Calculating the Average Range
I have decided to write this article on calculating the Average Range as it has helped me a lot understand in what kind of Market I am getting into, and helped me calculate the average risk , and what I can expect from the market I am trading.
Lets start by understanding what is the average range, how to calculate it and then I will move on to why it is important.
The Average Range is calculate by taking the high and low of the time frame you are trading over a certain period of time. This will give you an idea of the average movement your trade will have over your chosen time period. Now lets put this in an example below:
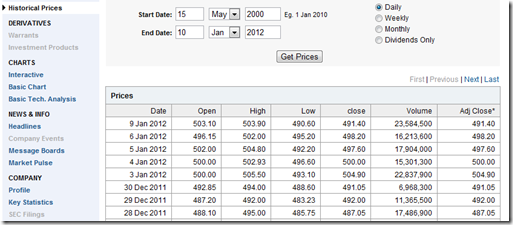
Shares: Lets say you would like to take a spread bet on HSBC, but you are unsure on the kind of risk you can expect in one day. What you do is, go to yahoo finance or your data provider, download the latest data of the time frame you are trading. Ok. Let’s do it together.
1) Go to Yahoo Finance.
2) Look for the share price using the name or ticker.
3) Go to the Historical Prices and download the latest historical prices.
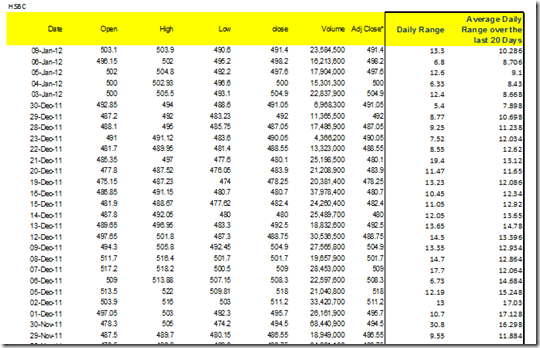
4) Once you have downloaded the prices take the High price + Low price and dive this by 2. This will give you the latest range. Do this Again for the last 20 Prices.
Now I will explain why the Average Range can help your trading As you can see from above the Average Daily Range of HSBC is around 10 points a day. When you are trading and you are unsure of your size, this will give you an idea of the daily risk. You know HSBA.L is likely to move between 8-13 points a day, therefore if if decide to trade £10 a point, you are placing a trade with a potential risk of 80 to 130 points a day.
Download the Money Management | Average Range excel sheet here
I hope you have enjoyed this, if you have any questions email me or add a comment, I will be happy to answer question.
Let’s Go one step further, Let’s see if we can calculate or predict HSBA’s High and low for today’s day might be.


