FTSE 100 Example

Here is an Example of trading the FTSE. I will first show you how to calculate the your bet size and bet risk. Then in the second part I will show you What to look out for and show you various strategies applied to the FTSE.

FTSE 100 Spread Betting Example

Here is a example of the FTSE 100. In this example lets assume you have already decided that you will spread bet the FTSE 100 up.
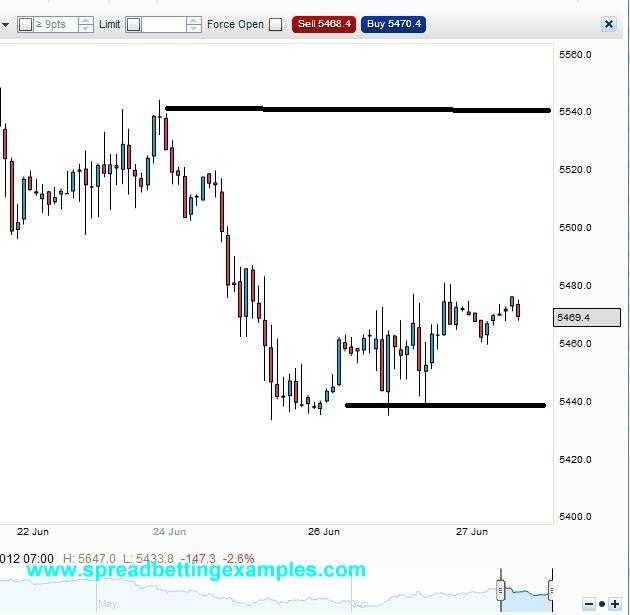
 

As you can see from the graph above the FTSE is currently trading at the spread price of 5468/70 with the mid price at 5469. In the Spread the price at which you buy is the offer price 5470 and the price at which you will sell is the bid, as you are selling to the buyers.
In this Example you believe that the FTSE will reach it’s previous high of 5540 but if it goes below 5440 you are happy to close your bet and cut your risk, take a loss.
Entry Long (current offer price) 5470
Profit Target (FTSE 100 previous high)- 5540
Stop Loss (FTSE 100 previous low) – 5440

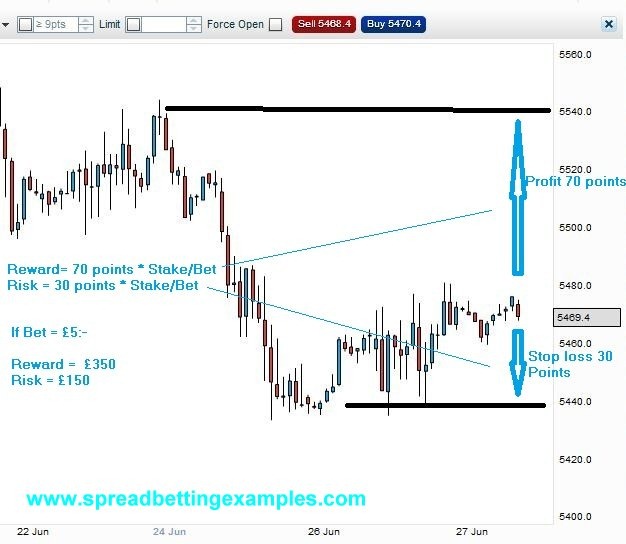
-Limit price is 70 points above the current price and stop loss is risking 30 points.
-You decide you would like to Risk No more that 150 pounds, just to test your belief.
Stake (Pounds per point) = 150 GBP the amount you risking divided (by the points risking) 30 = 5GBP
-Your stake is 5Pounds a point. What this means is that for every point that the FTSE moves up or down you will loose or make 5 Pounds

If instead it goes in your favour all the way to 5540 + 70 points * 5GBP = your profit will be 350 GBP.
Risk reward Ratio: Your risk reward ratio is a min of 1:2. You are risking 150 to gain 350.

What is good practice is also to know the full value of your bet, well the full risk. This is only if the FTSE shuts down overnight and your spread bet looses the full of the FTSE 100 value overnight:
The Nominal value of the trade is £5 * £5470 = £27 350
FTSE Spread betting example_b

To further help you in your Spread betting example, you can read calculating your risk

or back to the spread betting example section.

5 Min GBPUSD

Time frame: 5 Min

Indicators used / Settings:

  • Parabolic SAR : (0.1, 0.11)
  • Moving Average : SMA 20
  • MACD:(5, 8, 9)

Charts used: GBP

Possible other spread betting charts:

FTSE 100, DAX, EURUSD

********************************

Entry Rules:

Spread-betting long:

The Parabolic SAR will give you the direction. Therefore you wait for the Parabolic SAR to be below the price. When you see the candle stick bar close above the moving average and The MACD histogram is above the 0 line, this is an indication to spread bet long. You could be spread betting in the evening this trading strategy as the GBPUSD gives you enough movement also in the evening

Spread-betting short:

Going short is the opposite, wait for the Parabolic SAR to be above the price. When you see the candle stick bar close below the moving average and The MACD histogram is below the 0 line, this is an indication to spread bet long. You could be spread betting in the evening this trading strategy as the GBPUSD gives you enough movement also in the evening


Exit Rules:

stop loss: 12 point

target: 3 to 5 ticks target

This is a spread betting scalping strategy therefore the following money management rules apply. Use a 12 point stop loss and try scalp the market for 3 to 5 ticks target. how to determine if using 3 or 5 ticks? well if the moving average is sloping or not this will indicate if the pair is trending. in a trending market you could take more points out of the market in a quiet sideways market just look for 5 points.

********************************

Here is a spread betting example of this  scalping strategy:


Scalping Strategy- MACD-PARSAR-MA_2


Further spread betting examples / I spread bet this trading strategy at times on :

FTSE 100


Scalping Strategy- FTSE100 - MACD-PARSAR-MA


Fibonacci

Fibonacci Retracements are ratios used to identify potential reversal levels. Trader’s use these to predict where support or resistance levels are. The most popular Fibonacci Retracements are 61.8% and 38.2%.

Fibonacci numbers were identified by Leonardo Fibonacci, represent ratios that naturally occurred in Nature. Fibonacci numbers are simply a series of numbers that when you add the previous two numbers you come up with the next number in the sequence. Here is an example:  1, 2, 3, 5, 8, 13, 21, 34, 55 

 1 + 2 = 3;    2 + 3 = 5;

The main ratio also known as the Golden Ratio or PHI is 1.618 or the inverse 0.618. (calculated: number divided by the previous number approximates 1.618  55/34 = 1.618 or the other way round 34/55  = 0.618). Fibonacci numbers occur in nature and in the various markets as Forex, Stocks, Indices and commodities. There are many tools that incorporate the Fibonacci levels:

  • Fibonacci Retracements
  • Fibonacci Arcs
  • Fibonacci Fans
  • Fibonacci Time Extensions

Fibonacci Retracements

FTSE 100 -Fibonacci retracement(1)

The Fibonacci retracement tool is the most popular tool used applying the Fibonacci levels. To use the tool, just place the high and low on the highest point and the lowest point of the move, with the 0 at the extreme point of the move. The Fibonacci retracement tool will then project the retracement levels, as you can see in the spread betting example above.

In the graph above of the Spread betting index FTSE 100, you can see various levels projected which have become resistance while the FTSE was retracing it’s downward movement. Here is a spread betting strategy where the resistance areas where the FTSE Index stalled and retraced and presented itself as good trading opportunities are: 23.6% to 38.2% to a strong 50% then to 61.8%.

Once one resistance broke, this level then becomes support. Note in the spread betting example  how 23.6% was initially resistance then became support, the same with the  50% level which became support and 61.8% resistance.


Next:

ZigZag

ZigZag per se is not an indicator, but it is a filter to show you where the trend has changed. In various spreadbetting strategies this is very useful in showing you where to find support and resistance areas or various classic patterns like a double bottom, triple bottom head and shoulders.

As a spread bet trader you define the ZigZag Indicator filtering out what percentage swing you are looking for between the previous high and the previous low.  A 5% setting will draw a change of direction once prices have changed 5% for the recent peak or trough.

-Below is a spreadbetting example of the FTSE Index applying a 5% ZiZag Line

FTSE 100 -ZIGZAG indicator

The lower you apply the settings to the ZigZag indicator the more sensitive it will be to a change in price from the previous high and low. This is subjective to how much noise you want to filter from the price movement.

Below is a trading example of the FTSE 100 with a 2% setting, thus making it more sensitive to price change.


FTSE 100 -ZIGZAG indicator_2

You can apply this indicator on any Index, Forex currency, stock.

In the next article I will show you how to practically use the ZigZag indicator to filter out patterns or used also in the Elliot wave count.

Next: ZigZag – Practicle use.

MACD Convergence Divergence

Convergence and Divergence are very strong signals in the various spread trading strategies. Now we will see this applied to the MACD.

Lets recall:

Bearish Divergence is when prices of the Stock, index, Forex pair  are making new highs but the technical indicator is telling you the opposite, it is showing weakness.

Bullish Divergence is when, instead, prices of the Stock, index, Forex pair are making new lows but the technical indicator is not confirming the new lows, instead it is making higher lows.


Below is an example of the FTSE INDEX:

FTSE 100 -MACD spread betting divergence

In the above example we see the FTSE100 Index, this is a spread betting example of the MACD convergence & divergence spread betting strategy.

1) Bearish Divergence – Prices are making new highs. The second peak in the FTSE100 that follows is higher than the previous peak. Instead in the MACD crossover is showing weakness as it fails to confirm the highs by not following with a new peak.

1) Bearish Divergence – Prices are making new Lows. The second trough of the FTSE100 that follows in February is lower than the previous peak. Instead in the MACD crossover is showing strength as it fails to confirm the lows, instead it is making higher lows.

Previous: Spread Trading with the MACD Histogram

Exponential Moving Averages

Exponential Moving Averages

The exponential moving average also known as the exponential smoothing. This indicator is the one preferred by technical analysts of the various different moving averages, as it is a balance between the simple moving average, that lags and the weighted moving average that is over sensitive.

The simple moving average gives more weight to the current prices. Therefore it’s advantage is that it is quicker and follows the prices better. The disadvantage is that it ism more prone to whipsaw than the simple moving average.

From the chart you can see the difference between the simple moving average and the exponential moving average.

FTSE 100 - Exponetial Moving Average

As you can see the Exponential moving average follows the FTSE 100 closer. The SMA (Simple Moving Average) is less sensitive to price movement.


Now I will show you a spread betting strategy of two moving average cross and how the two different  averages react.


FTSE INDEX - 2 Exponential Moving Average Crossover_b


FTSE INDEX - 2 Simple Moving Average Crossover_b

You can see above how the exponential moving average crosses earlier than the simple moving average. giving you an earlier short spread betting signal. But it also gives you an earlier signal to close out your trade.

when deciding which spread betting strategy to use. You must decide which moving average will fit your style of trading. You could also mix the two. using an EMA to enter and a SMA to exit.


Next:Weighted Moving average

Spread Trading the MACD – Moving Average crossover

The way spread betters trade or interpret the moving average crossover is they wait for the signal line to cross over the MACD line, simply explained, the 9 EMA (which is the Fast line) cross the 26 EMA(the slower of the two lines).  Below is an example of the FTSE 100 Index using the MACD Moving Average Crossover:


FTSE 100 - MACD Crossover-Spreadbetting(1)


The MACD line is created by a 12 EMA moving average and a 26 EMA moving average.

A example of a spread betting strategy is:

Long:

when the MACD Signal Line (9 EMA – green Line) crosses the 26 EMA to the upside.

Short:

when the MACD Signal Line (9 EMA- Blue Line) crosses the  26 EMA to the downside.


The MACD can be used in another two was. That is using the MACD Histogram and using the MACD to spread trade Convergence and Divergence.


Next Page: Spread Trading with the MACD Histogram