Forex Spread Betting Example

Many have been reading about the Euro, and how, maybe, it might not exist anymore in 3 – 5 Years time.  The Euro moved steadily from 2005 where it was trading at 1.1700 against the USD  1.600 just before the financial crisis. In little over three month the eurusd moved from 1.6000 to 1.2314. This is a 23% movement from the beginning of August 2008 to the end of October 2008. From 2008 until today,  the Euro recovered faster than the USD as there was a general scare in the US debt, but then the debt fear spread into Europe, with Greece. The Euro in all this moved twice up and down between 1.500 and 1.2400.

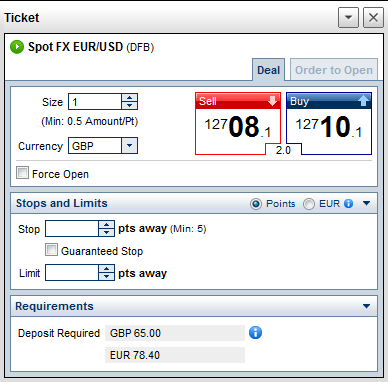
Many Spreadbetters are taking advantage of these moves, so lets look at a Forex spread betting example to show you how to trade the EURUSD and what kind of risk there might be. Let’s start off by looking ate the quote. The EURUSD is quoted as 12706.1/12708.1.

EURUSD Forex Spread betting example

The smallest unit we are trading or spread betting on, is the 06/08. For every point these move we are risking our stake. In other words if we placed £1 in the stake box as in the spread betting examples below, we are risking £1 per every point movement.
EURUSD_stake Forex Spread betting example

As you can see from the screen shot above of an IG Index platform, we will need a deposit of £65 to open this trade without a stoploss. If we place a stoploss, this margin requirement would decrease.

If Eurusd we decided to buy £2 a point at 12708.1 and the Eurusd moved to 12789/12791 we would have made 80.9 (12789 – 12708.1) points * £2, that is a profit of 161.81. If instead of moving higher the EURUSD moved lower we would have lost £2 a point for every point movement lower, until it reaches your stoploss. Remember to monitor your risk with Stoplosses.

The question is How do I know what stake I need to put for the EURUSD? You can do this by calculating the average range. If you do this you will see that the Eur moves on average 80 to 120 points in a day. That is nice movements for scalpers.

Back to spread betting examples

SPREAD BETTING EXAMPLES – Barclays Shares

SPREAD BETTING EXAMPLES – Barclays Shares


I  have always been of the opinion that the best way to learn a concept is through examples, and here I present a that applied to Barclays PLC  that will help your learn how to Spread Bet. So let’s get started.

Let’s say that you believe that Barclays shares were undervalued and that the market has sold them more on a small scare than a real change in company fundamentals. Therefore they have  a good chance of rising in the near future. One way of taking advantage of this oversold state, would be to invest money in Barclays and buy the actual company. If your analysis proved to be correct, and the share price did return to their correct value, you would sell your shares at a higher price, making a profit.

An alternative way of taking advantage of your opinion would be to make a spread bet, backing the price to move higher.

Most Spread betting companies have a two-way quote of prices, at which you can ‘buy’ (that is back the price to rise) or ‘sell’ (if you were expecting the price to fall). As it is a bet, all prices you do spread bet on will have an expiry. Normally the expiry co-insides with the expiry of the financial futures date. You cannot hold the spread bet forever, but you can close the bet any time you wish before the expiry date. Similar to conventional trading, you can close your trade at anytime.  Later I will expand on the expiry dates, but let’s keep it simple for now.  Let’s say that you only want to take a short term bet on Barc.l

(Below Spread Betting Example of Spread Betting on Barclays Shares)

Barclays Spread Betting Examples


On our Hourly Chart you see Barclays forming a support area at 170 and you decide to make an up-bet by buying waiting for it to reach 169-170 again and buying higher end of the quote (the difference between the sell and buy price is known as the ‘spread’, by the way, and is where spread betting obtains its name from).

Similar to Share Dealing, the bigger the deal size the more you risk or stand to make or lose money for a given movement in the price. In spread betting you don’t deal in numbers of shares or contracts, spread bets are denominated in a set Pound per Point movement. Let’s say you decide to buy £10 per point. This means that you will make or lose £10 for every point movement the share rises or falls .  184 is equivalent to £1.84 GBP the price of Barclays shares. Therefore one point movement is equivalent to one point movement. Therefore for every penny Barclays moves you will make or lose £10.

Over the next few hours the Barclays share price moves higher reaching 183-184 as you can see the picture in Barclays spread betting example.

You decide to sell your spread bet and take profit. You close your spread bet by ‘selling’ £10 per point at 183 (the lower end of the quote).

Your profit and Loss is calculated by subtracting the price you bought your Barclays share 170 from the price you sold your Barclays share at (183). You closed your bet 13 points higher making a profit of £130 profit.


Back to spread betting examples

CCI -1 Min Scalping System

CCI -1 Min Scalping System

This is Forex spread betting scalping strategy, I have used it on an MT4 but can also be applied to other charts
Trade From 8am UK time to 16 UK Time

Time Frame: 1 min

Forex Spread Betting Rules:

Trade Long:
Indicator: CCI (170)
Wait for the CCI 170 to cross the 0 Line showing an uptrend. It must be the first indicator to cross.
Indicator: CCI (34)
Wait for the CCI 34 to cross above the 0 line, also showing an uptrend. This must be the  second indicator to cross in the same direction as the CCI 170
Indicator: RSI
Price must be above the 14 Moving average

Trade Short: (opposite to the above)
Indicator: CCI 170
Wait for the commodity Channel Index (CCI) 170 to cross below 0 line, showing a down trend, and again t must be the first indicator to cross.
Indicator: CCI 34
Wait for the commodity Channel Index (CCI) 34 to cross below 0 line, showing a down trend, and again t must be the second indicator to cross.
Price must be below the 14 Moving average

Settings:
CCI 170 PERIOD 170
CCI 34 PERIOD 34
Moving Average 14

Important: This system relies heavily on support resistance, Fibonacci levels and pivot points. so if you are near near a support and resistance line, wait to see what the price reaction will be. Wait to see if prices break the support and resistance or bounce off these levels. Always follow the trend and look to buy and tops and bottoms.

Forex Spread Betting Examples of the CCI -1 Min Scalping System applied to the EURUSD:

CCI -1 Min Scalping System

In the spread betting example, you can see I only took the longs trades as only in the long signals did the Commodity Channel Index 170 cross above the 0 line before the Commodity Channel Index 34


I Thank Canadian Dude for inspiring this Forex Spread Betting Strategy.

Back to

Price Action-1-2-3 Trade system

Price Action–1-2-3 Trade system

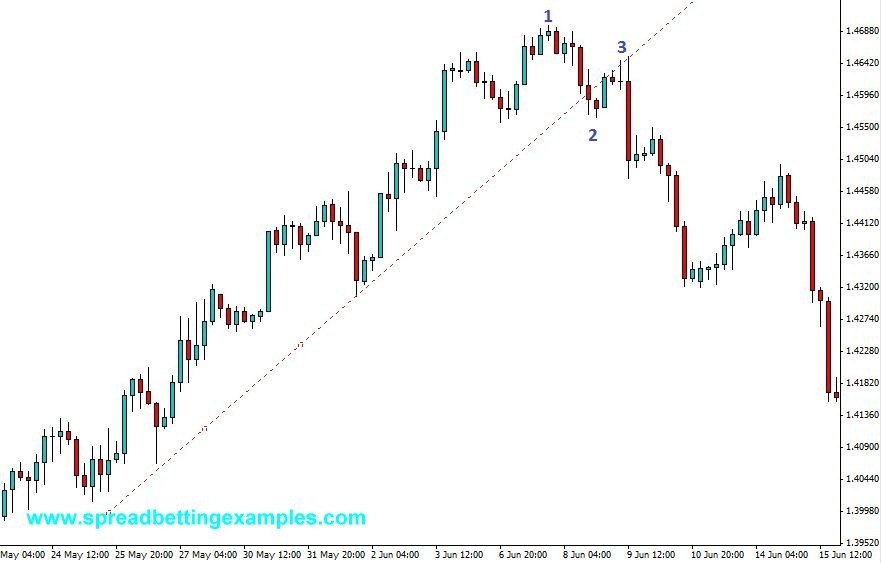
This strategy is a very simple and logical strategy used throughout the trading world. The Price Action 123 Spread betting Trade System takes a new trade when prices fail to make new highs or new lows.  The below is set on a 4HR chart but this can be used on any time frame. I have also pictured this strategy on the EURUSD. This is my favourite pair and the forex spreadbetting pair I specialize in.

There are no indicators, it is all price action. This is considered a reversal strategy.

********************************
Summary
Time frame: 4HR
Tag: EURUSD
Indicators used : None
Type: Price Action
Timeframe of trade: Swing

********************************

Entry Rules:

Entry occurs after a trend has been underway for sometime, and prices have reached extreme levels. These levels will no longer be sustainable, and prices will fail to make new lows or new highs.

Below is a spread betting example of the Price Action–1-2-3 spread betting system.


Price Action–1-2-3 Trade system

Spread-betting short:

This is opposite to the above entry signal; instead prices have reached new highs and fail to move higher, interrupting the up trend.

A) 123 – Lower High
After prices have been making new highs and higher Lows, the new highs are not sustainable anymore and the highs make a lower high (3). Here the bears have overpowered the bulls and it is time to trade short unless you a conservative trader that you wait for prices to bear point (2).

B) 123- Double top.
Similar to the above scenario, you will instead have prices form a double top at the highs, fail to break the highs and move lower. Here is your entry signal, or, again if you are a less aggressive trader wait for the prices to break point 2.


Spread-betting long:

There are two buy scenarios:
A) 123 – Higher Low
This scenario is when prices have been falling making Lower Lows and Lower Highs. At the end of the downtrend the low does not make a new low, but makes a higher low. Now you can spreadbet long when prices fail to make a new low. A less aggressive trader will wait for the prices to move higher past point 2 then he buys.

B) 123- Double Bottom
In this scenario, at the end of the downtrend the low does not make a new low, but makes a double bottom, not breaking into new lows. This is a signal to trade long. A less aggressive trader will wait for the prices to move higher past point 2 then trade long.


Exit Rules:
Exit the trade either at target profit or when the opposite signal occurs, that is when the trend fails to continue and new highs or lows fail. Use your money management rules

********************************


Back to Advanced spreadbetting strategies

Parabolic SAR

The Parabolic Time/Price System or better known as the Parabolic SAR is an entry and exit system created by J.Wells Wilder. SAR = “Stop and Reverse” .

It combines price and time components to generate your spread betting long or short signals. The Parabolic SAR adapts to the change. It is also an effective tool to determine where to place your stop loss.

GBPUSD -Parabolic SAR indicator


Long Spread Trading Signal

When to take a long spreadbetting strategy? When the candle finishes above the Parabolic SAR and the Parabolic SAR indicator changes from being above the price to being below the price.  The Parabolic SAR indicator was used as a stop and reversal trading strategy, where you would not close your position but would turn it around from a long to a short trading. The Parabolic SAR Indicator can be applied to Forex, stocks, indices,


Short Spread Trading Signal

Opposite to your long trading strategy, When the candle finishes below the Parabolic SAR and the Parabolic SAR indicator changes from being below the price to being above the price, this is the signal to go spreadbet short.


Now the next page will show you how the Parabolic SAR is extremely useful for knowing where to place your stop loss.


Next: Parabolic SAR Stop loss

Spread Trading with the MACD Histogram

The MACD Histogram is very good strength indicator / momentum indicator. The Histogram is constructed by the difference between the Fast MACD line (green Line) and the slower MACD Signal Line (blue Line).

The moment the faster MACD Line moves faster that the the MACD Signal Line, this creates a bigger gap between the two and the Histogram increases as it measures the difference between the tow. Therefore if a stock is having short term strength relative to it’s previous trend the histogram will in increase. If the trend in the short term has changed and the gap narrows the histogram will decrease.


A spread betting strategy is to trade this change of direction or strength, is to:

Spread bet Long:

When the histogram has been in a downtrend and now starts flattening and changing direction to the upside.

Spread bet Short:

when the histogram has been in an uptrend and now starts flattening and changing direction to the downside.


what you are doing is that you are capturing the momentum trade.


FTSE 100 -MACD Histogram spreadtrading


Next: Spread Betting the MACD Convergence Divergence

Previous: Spread Trading the MACD Moving Average

Spread Trading the MACD – Moving Average crossover

The way spread betters trade or interpret the moving average crossover is they wait for the signal line to cross over the MACD line, simply explained, the 9 EMA (which is the Fast line) cross the 26 EMA(the slower of the two lines).  Below is an example of the FTSE 100 Index using the MACD Moving Average Crossover:


FTSE 100 - MACD Crossover-Spreadbetting(1)


The MACD line is created by a 12 EMA moving average and a 26 EMA moving average.

A example of a spread betting strategy is:

Long:

when the MACD Signal Line (9 EMA – green Line) crosses the 26 EMA to the upside.

Short:

when the MACD Signal Line (9 EMA- Blue Line) crosses the  26 EMA to the downside.


The MACD can be used in another two was. That is using the MACD Histogram and using the MACD to spread trade Convergence and Divergence.


Next Page: Spread Trading with the MACD Histogram

Trading the Commodity Channel Index (CCI)

Trading the Commodity Channel Index (CCI)

Reversal Strategy

Commodity Channel Index (CCI)

 Many use the CCI as an oscillator, as it comprises of 75% of the prices within -100 and +100:

 Spread bet Sell signal: when the channel crosses above the +100 and then falls back below the +100 line.

Spread bet Buy signal: when the channel crosses above the +100 and then falls back below the +100 line.


Trend Following Strategy

The CCI Channels can also indicate when a trend is starting:

Uptrend: When the CCI is above +100 and stays there this indicates a trend is underway. Often this is used with other indicators as a confirming tool. You can use a 3 EMA with the CCI Channels. As you can see from the example above.

Downtrend: When the CCI is above +100 and stays there this indicates a trend is underway. Often this is used with other indicators as a confirming tool. You can use a 3 EMA with the CCI Channels.


Previous Page:The Commodity Channel Index (CCI)


Commodity Channel Index (CCI)

Technical Indicator: Commodity Channel Index (CCI)


The Commodity Cannel Index (CCI) is a very popular indicator used mainly to show overbought and oversold areas. Developed by Donald Lambert mainly for commodities, it is not used on a wide variety of products. The CCI measures the current price relative to an average price, usually 20 prices. These have been created so that between +100 (overbought) and -100 (Oversold) they represent 75% of the price movement.

Often found on most spreadbetting charting packages as there is no volume involved. It is very easy to apply to your spreadbet charts.


Next Page:Trading the Commodity Channel Index (CCI)

On Balance Volume

Volume Indicator: On Balance Volume


On Balance Volume is a tool that quantifies the strength of a price movement or trend. It helps you identify if it is weak or strong.

It is very easy to calculate:

If today’s price closes above yesterday’s price, then we give the volume a positive number. If instead today’s close is below yesterday’s close, we assign the volume a negative number. The close can be one also just one pence. The only thing that is important is the direction of the price, if it is up or down.

The volume is then added up, and an index is created.


For those spread betters that are mathematically minded.


Calculations:

OBV = ( (C-P) / |C-P| * V


Interpreting the On Balance Volume:

As Most Volume indicators, On Balance Volume can be used as a warning tool or confirmation tool.

Confirming tool


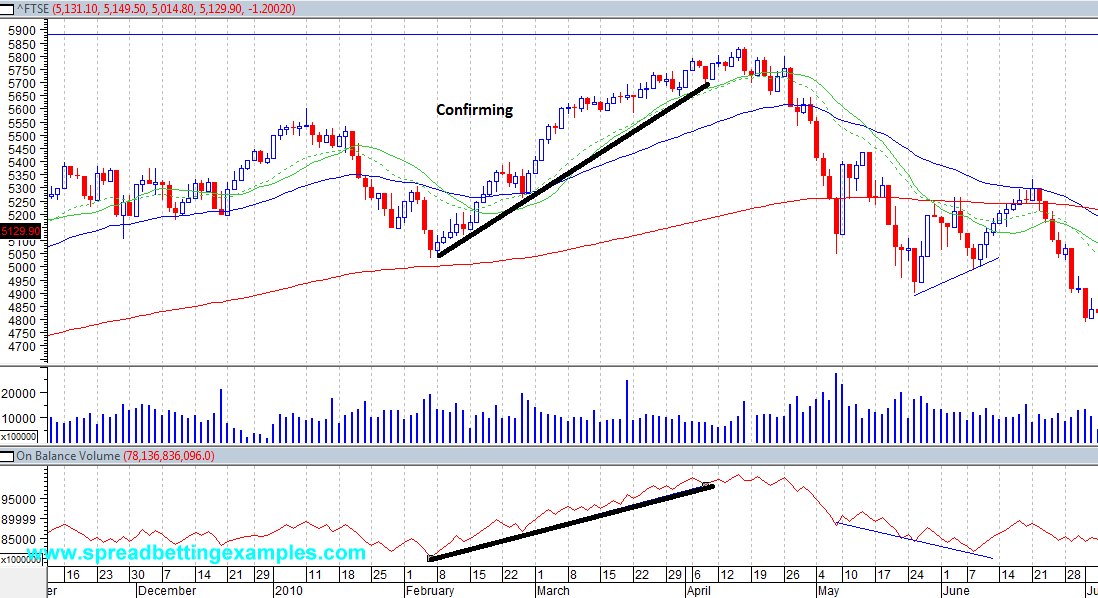
As you can see in the FTSE Daily Bet, The on balance volume is initially confirming your trade. The on balance volume is making new highs as the prices are making new highs. The On Balance Volume is confirming a strong uptrend in the FTSE 100.

There is a strong commitment from buyers.


Divergence: A warning tool

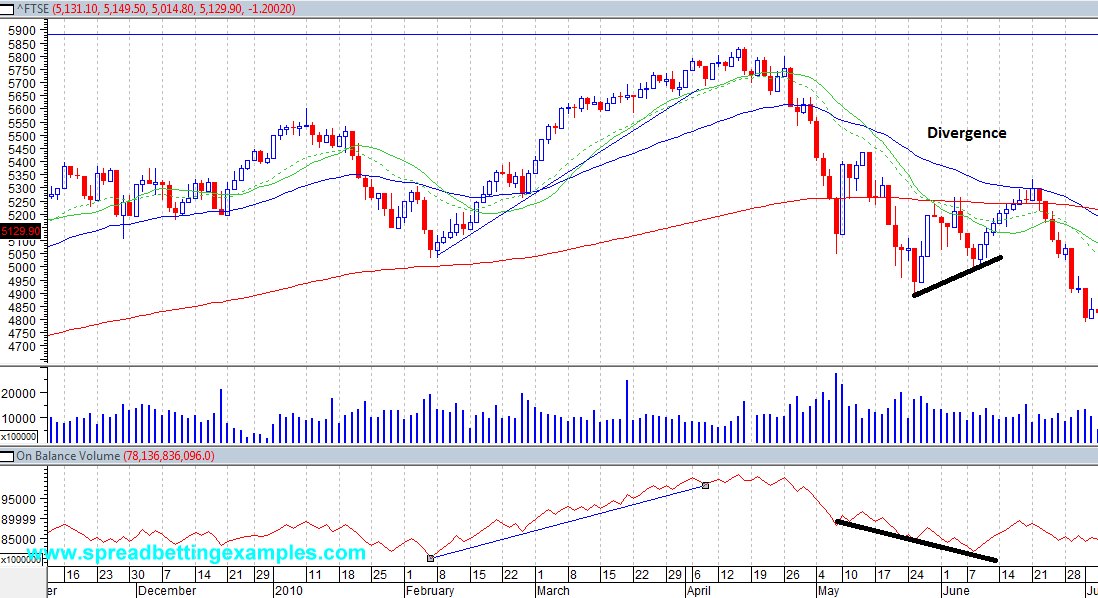
Instead in the other part of the FTSE Daily Bet, The on balance volume is showing weakeness as it is making lower lows while the FTSE makes higher lows. After the second peak you can see prices turn around and move lower.

The On Balance Volume has warned those spread better of a possible short, price reversal in the FTSE.


Charts** Not all spread betting platforms provide volume, thus you might not have the On Balance Volume. You will get this on private charting packets.

In conclusion, the On Balance Volume can be used as both a warning tool and a confirming tool.

It is important to add a volume indicator in your price analysis, other volume indicators you can use are the Accumulation Distribution, MFI (Money Flow Index), Chaikin Oscillator and the Price volume trend indicator.