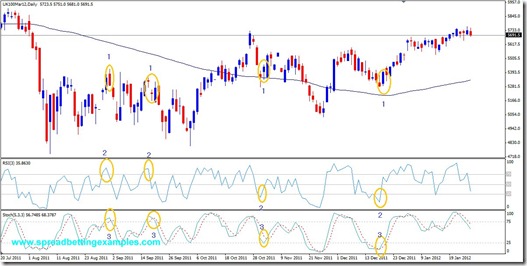
Footsie 100 RSI–Stochastic-Simple Moving Average
This is a simple spread betting strategy, it is made up of three indicators. More indicators you apply to a strategy more you filter the buy and sell signals. When coming across a new strategy it is always best to make the strategy yours. When I say make the strategy yours I mean, know the pros and cons of the individual indicators, back test it a little by looking at historically where it would have made you money and where it would have lost you money. This strategy is also good for those that don’t have much access to your trading screen during the day. Now lets step straight into the strategy.
Trading setup:
Simple Moving Average (100)
RSI (3) with horizontal lines at 70 and 30,
Full Stochastic (5, 3, 3) with horizontal lines at 75 and 25
Time Frame Daily Chart
Footsie 100 Spread betting example
Trading rules:
The Simple moving average gives you the direction of the trade. If your price is above the simple moving average then you will look for long trades, if instead the price is below the simple moving average you will look for short trade entries. In this strategy The RSI (relative strength index) has a small time frame therefore it will make sudden shifts as the prices change direction. In this simple strategy the the RSI will give you the signal to buy and sell before the Full stochastic.
Enter a long spread bet, when prices are trading above the 150 simple moving average & you see the RSI moving up from below the 30 level moving higher. As the RSI has crossed the 30 Line upwards, keep your eyes o the stochastic, and wait for the stochastic to move from below the 25 line crossing upwards. As the stochastic moves above the line, you can enter your long trade. Some will wait for the next candle of the next day to take the trade. They will take the trade as the FTSE opens the next morning, or place an order to buy the UK100.
If at least one of the conditions is not met – stay out.
The Short spread bet is the opposite to the above trade: when the FTSE100 price is trading below the 100 SMA, look for only short entries. Now wait for the RSI move down lower from above the 80 mark to below the 80 line moving to the downside. Now again, wait for the Stochastic lines to cross the 70 line lower, heading south- enter your Short.
The Stop Loss. You should abide to your money management rules, but here are some cases where stop losses could be placed. The stop is placed at the moment of entry and is adjusted to the most recent swing high/low.
Profits taking suggestions:
-when the crosses the opposite line. If you are long. The Stochastic moves up above the 75 line, or if you are short the Stochastic moves up lower the 25 line.
-Or simply, you can have a trailing stoploss.
This strategy has good potential. Make it your own. Do not try to anticipate signals. If there is no signal don’t trade it or force the trade.
Back to Simple Trading Strategies
