Forex Spread Betting Simple Trading System

Forex Spread Betting Simple Trading System

This is a Forex Spread Betting Simple trading System that is mainly used on the Pound or on the Euro. I will show you how I set up my Charts in My IG account and how to trade the system.

Setting Up the Charts: If you go the the options tab on the top right hand side, click on options. To the Chart you add:
Parabolic SAR default settings which are 0.2 /0.2
Exponential moving average of 20 periods
And the Commodity Channel Index, I use the default 20.

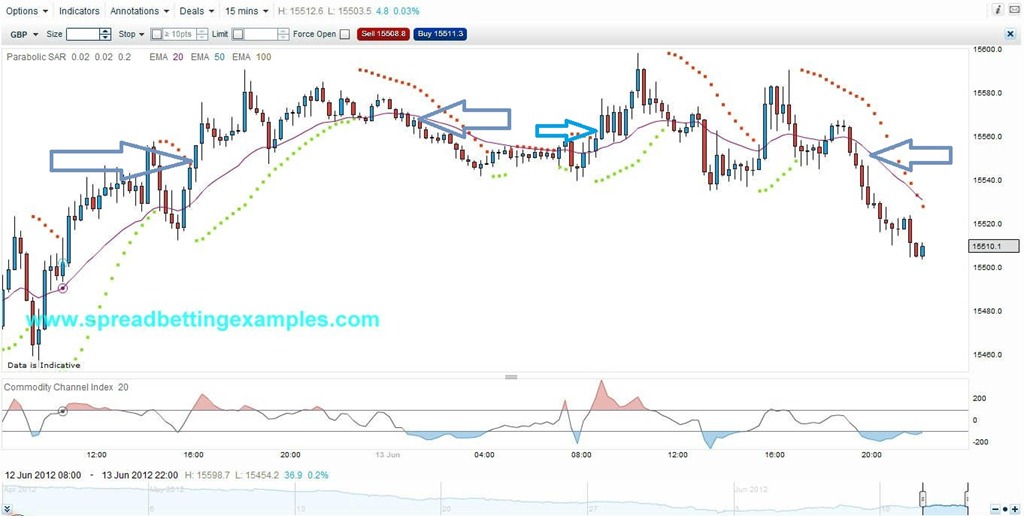
Below is a 15 Minute Chart
Forex Spread Betting Simple Scalping System_b

How to trade this system:

For those more experienced, use the parabolic SAR as your indicator to enter the trade or close your trade. Wait for the candle stick to complete.

For those less experienced – wait for the Parabolic SAR to give you a sell or buy signal. You wait for the price to cross the moving average. The moving average acts as your confirmation tool. If both signals don’t occur don’t take the trade.  For Example:  In the graph above in the first arrow you can see the Parabolic SAR gave you a buy signal the prices have moved above the moving average, this is when you enter your trade. Your stoploss below the current candle to at least half way the distance of the previous candle. As prices move higher  trail your stoploss higher. For the more experienced traders, you can trade without the moving average.

Forex Spread betting simple trading system main rule: Know your support and resistance levels, as it is at these levels where you will have a normal movements or confirming actions. Take this system make it yours create a plan following strict money management rules and trade it without emotions.

If you would like to read more on trading look at our new section Best trading books

or return to simple spread betting tips or the home page: Spread betting examples
Gold Pivot Point Strategy

Gold Pivot Point Strategy

Pivot points are a very old way of calculating support and resistance points in a chart. The calculations is very simple as it was widely used in the commodity pits and these calculations were done mentally while traders were deciding to or not take trades.

This is the Pivot point Formula: P = (H + L + C) / 3. (P= Pivot Point, H = High L = Low). Then you have your resistance R1 = P + (P − L) = 2×P − L and Support S1 = P − (H − P) = 2×P − H levels. To learn more about pivot points you can read further in the technical analysis section: Pivot Points.

Getting back to the strategy. As we said this is a strategy to adopt not when you expect very strong news but on quiet or normal (Non news rich) days, or at least adopt with caution. During high volatility is when this strategy can stop you out.

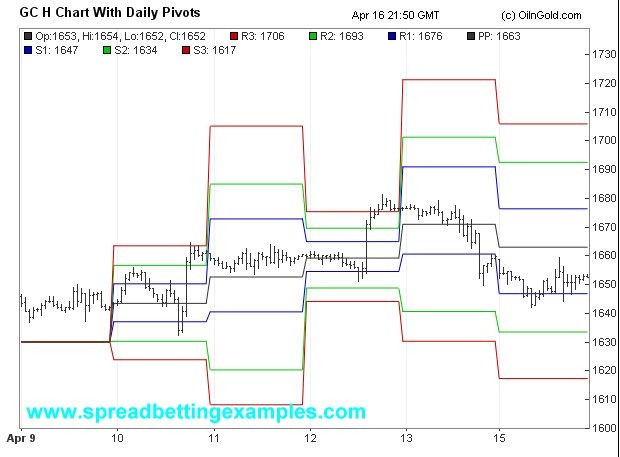
As you can see from the graph above, there are various support and resistance levels. Normally you have R1, R2, R3 and S1, S2, S3. The further out the support and resistance the less likely you will be filled. But you can trade the various support and resistance levels according to the volatility.

I prefer to trader S2 and R2 and I have less risk tolerance and more patience. If you trade R1 and S2 you will get more trades and be stopped out more often, and on the other hand, S3 and R3 you might not get a trade.

Well let me explain How to trade this . This is a mean reversion strategy, that means you place your order to buy and sell on the support and resistance levels and when your order is filled you want the price to return to the pivot, or the middle. The pivot is also considered the average level. At this point is where you close out your trade, and take profit. A Practical Example 1. You believe that the trend is going up, so Ideally you would place your order to buy on the support 2 level(the green line), with your stoploss just below S3. You wait for an unexpected change in trend (temporary in nature) to drop to the support then bounce off this level and move back up in the direction of the trend. Once it reaches the pivot you take profit.

A Practical Example 2. Another example would be, you believe that the trend is moving up, and News has just come out that has pushed the trend further up. You believe that R3 is far over done and therefore your decide to place your order to sell at at R3, looking to take profit on the retracement down to R2 level. This is a riskier trade as you are going against the trend, but it is important that you manage your risk.

Another tip on pivot point trading: If the support and resistance levels coincide with another strong technical indicator, example a 50 day moving average, this level become even stronger.

Now these are very simple strategies to execute what you got to know or have the feel is of the actual Gold market and the fundamental news that is coming out that day.


if you have any questions email me, or if you believe I have left something out. Click here to return to the main menu simple spread betting strategies or if you you want to go back to Gold trading strategies

Gold Break Out Strategy

Gold Break Out Strategy

Lets get straight down to the strategy. This strategy is a very simple concept but it is important you manage your risk.  You must also know your risk tolerance as you may have a few false break outs and when you give in that is when the break out will occur. So as simple as the strategy might seem, be prepared have your risk well planned out. Here is a tip on how to calculate the average risk.

As we said earlier in the gold trading strategy post a break out will occur when the market has gone quiet and you are anticipating news of data that could move the market. In this you calculate the range of Gold and draw a line above the resistance and one below the support. You will place a break out order just above or below these two lines. Again your risk is if traders do a false break out, that is they test the support or resistance lines, but fail to break these.

Gold Break Out Strategy

As you can see from the picture above the prices stay in the range and try to break it a couple of times. Until there is a break. This break continues until it finds the next support and resistance level.

Gold Break Out Strategy_2

As you can see form the above scenario this strategy can be quiet profitable and tradable.

On the other hand here is an example of a sudden movement that is completely unexpected. This was during Ben Bernanke’s testimonial in front of congress, as investors were waiting for Bernanke to do more quantative easing, he disappoints investors. By Bernanke not pledging for more stimulus traders ad investors started taking their money out of the safe haven and inflation hedge, “Gold” and started moving their money into more riskier assets. As you can see in the graph below Gold was building up towards a pledge of more stimulus. It had been moving up from the 20th of February, but at the hearing it suddenly dropped 5% after Ben Bernanke’s comments. This had been the biggest drop in 3 years.


Gold -Bernanke no more quantative easing

In this scenario a Gold Break Out Strategy

would have been very profitable. This was a scenario when you know that Bernanke is expected to speak, you draw your break out lines and you place our order. But Be carefull you are not caught on the opposite side of the trade. Your stop loss could get slipped.

Next Strategy I will discuss is the Gold Pivot Point Strategy

or you can return to  Simple spread betting strategies

Gold trading strategy

Gold trading strategy

Well Now that you have just gone through the Gold spread betting example , I will now show you two different Gold Trading strategies. Gold like many commodities are still traded using Pivot Points.

There are two types of strategies one can use to trade gold. They are both commonly used but the trick to success is know what kind of market you are current in.  Well I guess this applies to all strategies. Let me elaborate further, If there has been strong news in the market regarding inflation, prices on commodities or about the economy not doing to well, many will find refuge in Commodities, as especially gold, is seen as a safe have. In this case Trading a commodity break out strategy would be beneficial. You could expect to trade a Gold break out strategy even if there is economic data or if Ben Bernanke is speaking and you expect the data or Bernanke to speak about quantative easing. This will probably affect the gold market. In this case you are anticipating a dramatic move in the Gold market and thus can use the Gold Break out trading strategy. As you can see from the Graph below, this would mean taking advantage of sudden movements like the one below.

Gold Break Out Strategy

Gold Spread bet example

Gold Pivot Point Strategy

Instead if on the other hand there is no news expected in Gold, or the market has already made  a drastic move and the commodity is currently retracing, You can use a Gold retracement strategy, Using Pivot points to trade Gold.

Gold Trading Strategy


Next: Gold Break Out Strategy

Gold Pivot Point Strategy

Home:

Spread Betting System–Range Trading

Spread Betting System–Range Trading

This is a very simple spread betting strategy, requires no indicators, but I would say you do need some trading experience before starting out with this strategy. I say this only because more experienced traders know how to deal with the psychology of trading and have an idea when to apply this spread betting system.

Pair: USDCHF
Time: 15/30 min


Wait for the pair to come out of a upward or downward movement. Once the markets have calmed down and you believe there is no major news anymore, and that the pair will start trading sideways. Draw your support and resistance lines and trade the range.


image

Footsie 100 RSI–Stochastic-SMA

Footsie 100 RSI–Stochastic-Simple Moving Average

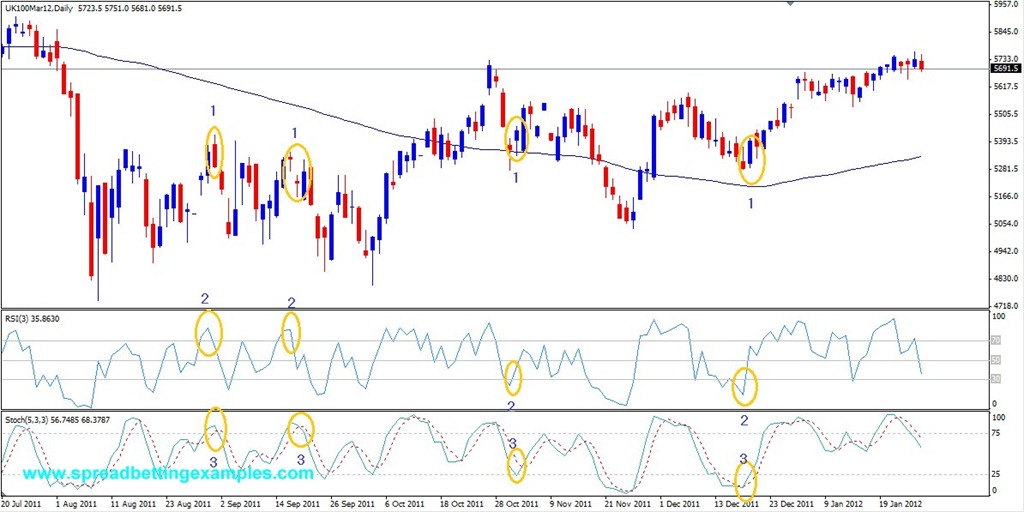
This is a simple spread betting strategy, it is made up of three indicators. More indicators you apply to a strategy more you filter the buy and sell signals.  When coming across a new strategy it is always best to make the strategy yours.  When I say make the strategy yours I mean, know the pros and cons of the individual indicators, back test it a little by looking at historically where it would have made you money and where it would have lost you money. This strategy is also good for those that don’t have much access to your trading screen during the day. Now lets step straight into the strategy.

Trading setup:

Simple Moving Average (100)
RSI (3)
with horizontal lines at 70 and 30,
Full Stochastic (5, 3, 3) with horizontal lines at 75 and 25
Time Frame Daily Chart


Footsie 100 Spread betting example

Footsie 100 RSI–Stochastic-Simple Moving Average


Trading rules:

The Simple moving average gives you the direction of the trade. If your price is above the simple moving average then you will look for long trades, if instead the price is below the simple moving average you will look for short trade entries.  In this strategy The RSI (relative strength index) has a small time frame therefore it will make sudden shifts as the prices change direction. In this simple strategy the the RSI will give you the signal to buy and sell before the Full stochastic.

Enter a long spread bet, when prices are trading above the 150 simple moving average & you see the RSI  moving up from below the 30 level moving higher. As the RSI has crossed the 30 Line upwards, keep your eyes o the stochastic, and wait for the stochastic to move from below the 25 line crossing upwards. As the stochastic moves above the line, you can enter your long trade. Some will wait for the next candle of the next day to take the trade. They will take the trade as the FTSE opens the next morning, or place an order to buy the UK100.
If at least one of the conditions is not met – stay out.

The Short spread bet is the opposite to the above trade: when the FTSE100 price is trading below the 100 SMA, look for only short entries. Now wait for the RSI move down lower from above the 80 mark to below the 80 line moving to the downside. Now again, wait for the Stochastic lines to cross the 70 line lower, heading south- enter your Short.

The Stop Loss. You should abide to your money management rules, but here are some cases where stop losses could be placed. The stop is placed at the moment of entry and is adjusted to the most recent swing high/low.

Profits taking suggestions:

-when the crosses the opposite line. If you are long. The Stochastic moves up above the 75 line, or if you are short the Stochastic moves up lower the 25 line.
-Or simply, you can have a trailing stoploss.

This strategy has good potential. Make it your own. Do not try to anticipate signals. If there is no signal don’t trade it or force the trade.


Back to Simple Trading Strategies

Elliot Wave

Elliot Wave

Elliott Wave Principle is a form of technical analysis that some traders use to analyse financial market cycles and forecast market trends
Elliot wave were discovered by the professional accountant, Ralph Nelson Elliott (1871–1948). He stated that prices move in waves. These waves repeat in cycles over and over again. The waves are:
(1) move up, (2) partial retracement, (3) Move up, (4) retracement, (5) the final move up. Then starts the retracements cycle: (A) Full retracement (b) partial retracement, (c) a full move downward. Then the two cycles start again.  Look at the below to see the cycles. This picture was taken from Steve Nison’s book: “Japanese Candlestick Charting Techniques”.


elliotw1

Below you can see the various cycles. The Elliot Wave cycle repeats in both macro and micro time frames, as you can see above:

  • GrandSupercycle
  • Supercycle
  • Cycle
  • Primary
  • Intermediate
  • Minor
  • Minute
  • Minuette
  • Sub-Minuette
  • elliotwaves


Let’s go through a Spread trading example of how the Elliot waves are applied to spread betting strategies:


Elliot Waves


How to spread bet with the trade the Elliot waves:

Elliott Wave is based on crowd psychology. There are two types of waves the  impulsive wave and corrective wave, booms and busts, rallies and retracements.
The Elliot waves tell traders where trends are likely to stop or come to a halt, and these are areas where they take advantage of placing their buys or profit areas.
The chart above illustrates the Elliott Wave pattern applied to EURUSD.

As the A,B,C corrective Waves finish we have the first leg upwards 1. When the upward movement seems to have finished ad starts turning the traders look at putting their buy orders at the 38% retracement, and looking for an upward extension of the wave 3. In the EURUSD above, the prices bounced off the 38% retracement moved a little higher, then came back down and stopped out the traders that had bought at the 38% retracement.  The spread betters decide now to wait for the 50% retracement and place their buys again. At the 50% retracement they are looking to do the same trade, run it until the extension of wave 3, which is 1.618 projection upwards. The Elliot waves are based on the Fibonacci levels. Once money has been made, they wait for the 38% retracement again at level 4. After the last move higher finishing in wave 5. Traders are expecting now a corrective wave.

Spread betters would now not go against the trend but wait for a retracement of the first A wave down, at point B (retracement) and Short the EURUSD on the C leg all the way down to 100% retracement. On the other hand, Some spread betters wait for the C wave to complete then trade long. They would use the 61% (golden Fibonacci ratio) and 100% retracement to see/expect where the wave will end.

Further reading would be the Fibonacci Levels

Back to simple spread betting strategies

Stochastic 14-3-3 or 5-3-3

#4 ) Spread Betting with the Stochastic Oscillator

Charts used:
Tag: scalping,  Day Trading, Swing Trading, Stochastic
Indicator: Stochastic Indicator 14, 3, 3 or 5, 3, 3 for a more sensitive Oscillator reading
Time frame: Any.

Many of you have asked yourself how to use the stochastic in spread betting?

The stochastic is an oscillator and shows you when the markets are overbought or oversold. Spread Betting Systems which adopt a Stochastic indicator for monitoring the price provide some very good tips about the situation of the market.

Scalpers can use the more sensitive settings 5,3,3.

Entry rules: Go long when the Stochastic has crossed below 20,  and then crossed back up through 20.
Go Short when Stochastic has crossed above 80, and then crossed back down below the 80.

Exit rules: close trade when Stochastic lines reach the opposite lines (80 for Buy order, 20 for shorts).

Advantages: gives quite accurate entry/exit signals in well trending market.

Disadvantages: You need to monito this periodically, as when markets trend the stochastic’ 20 – 80 range  could change to 30-90

I have used this on my Igindex for commodity trading as commodities often change direction adruptly.

RSI (Relative Stregnth Index)

#3) RSI (Relative Stregnth Index)

Charts used:FTSE  , Cac30 , Barclays , S&P
Tag: Scalping, Day Trading, Swing Trading
Indicator: RSI – Relative Strength Index
Time frame: Any.

No trading system can rely only on the RSI indicator, but should be used in combination with other indicators or price action. The RSI can give you an edge in your spread betting technique. Before attempting this strategy, read The RSI: The Relative strength article.

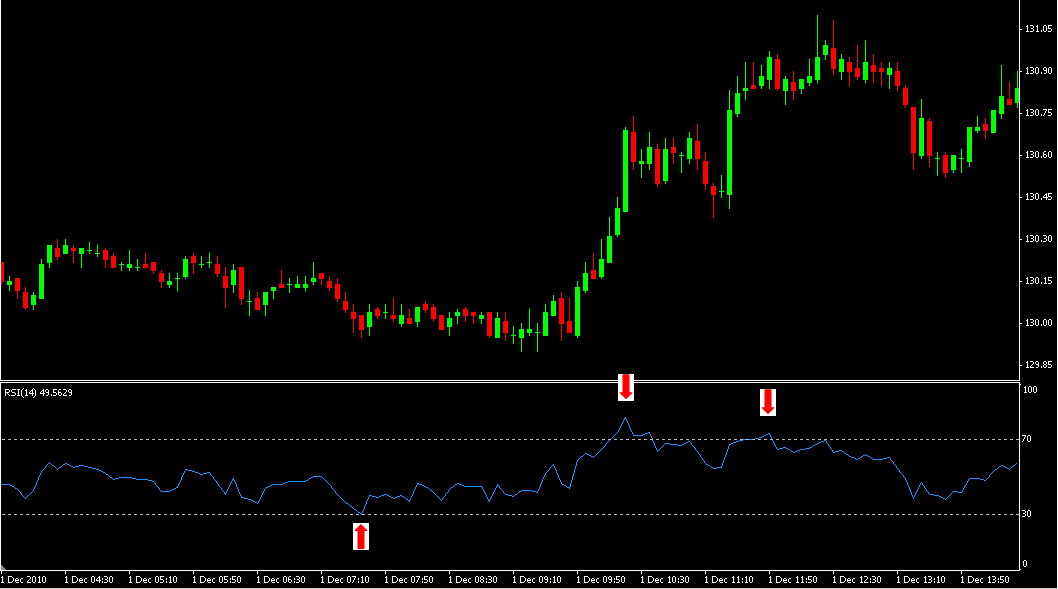
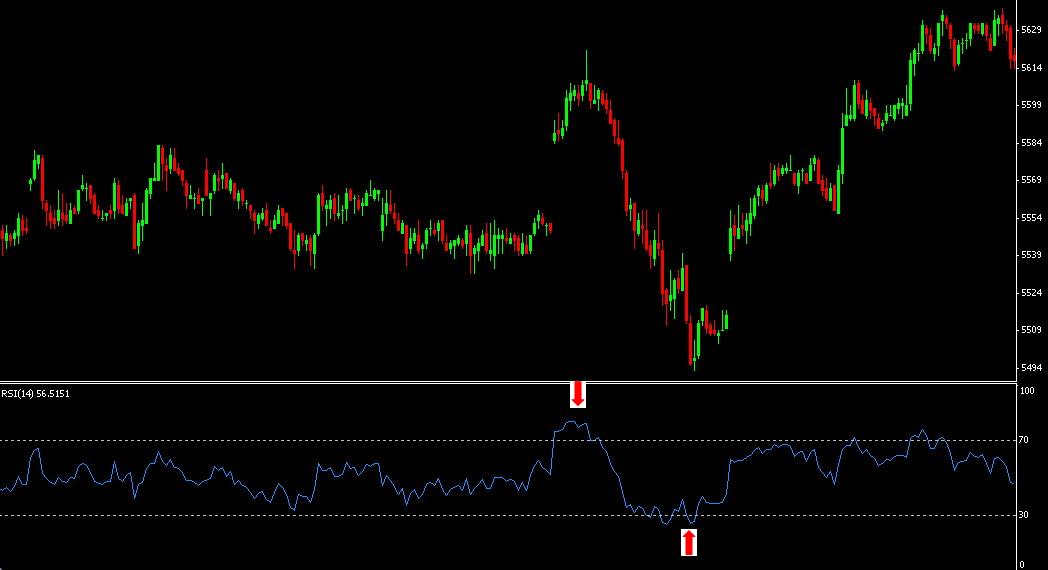
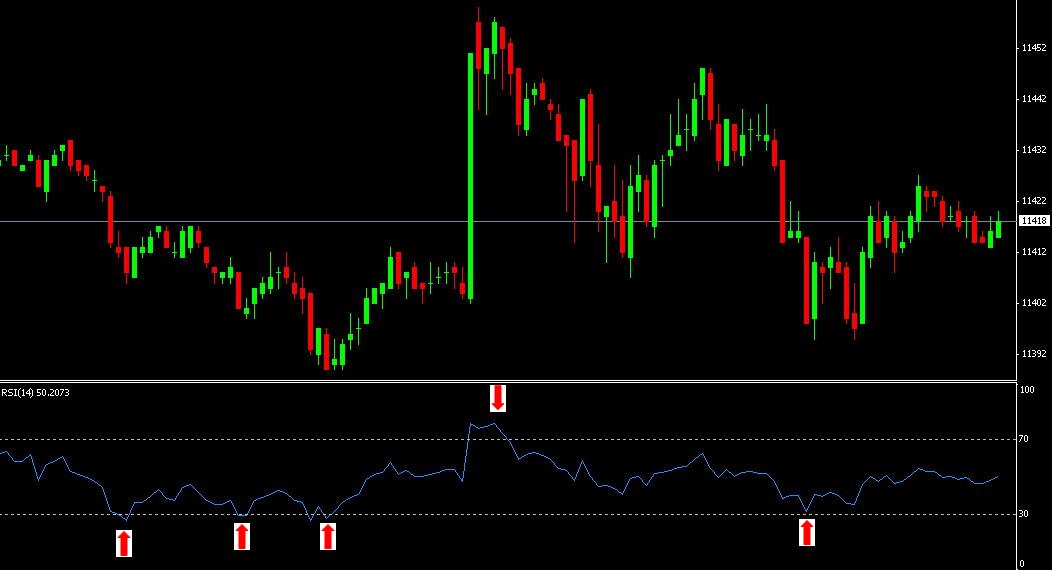
We set the RSI at a period of 14 and monitor the levels 70 and 30.(The RSI is an Oscillator and above 70 indicates that the prices are overbought, below 30 indicates that the prices are oversold).

Entry rules: Buy when the RSI crosses below 30, forms or has formed a bottom, and then crossed back up through 30.
Sell when RSI has crossed above 70, formed a peak, and then crossed back down through 70.

Exit rules: not set. Or use your money management

Advantages: RSI is a very good indicator to refer for confirmation when you are ready to enter a trade in any simple or complex trading system. Best used when trying to trade in a contratrend or or range trading market. In a trending market the RSI, can give false signals.

Disadvantages: You need to monitor your trade, as the RSI alone can give false signals when the market is trending. The RSI Oscillator should be used in combination with other indicators.

Financial Spreadbetting techniques and Tips on how to use the RSI:

Moving Average breakout- Spread Betting System

#1) Moving Average BreakOut

This is a very simple, effective and widey used spreadbetting strategy. Many professionals and non-professionals use the the Moving average to identify the trend of the trade, or direction to spreadbet.

Time frame:any. Preference 1hr, 4hr Daily
Tag: Day Trading, Swing Trading, Long term trading
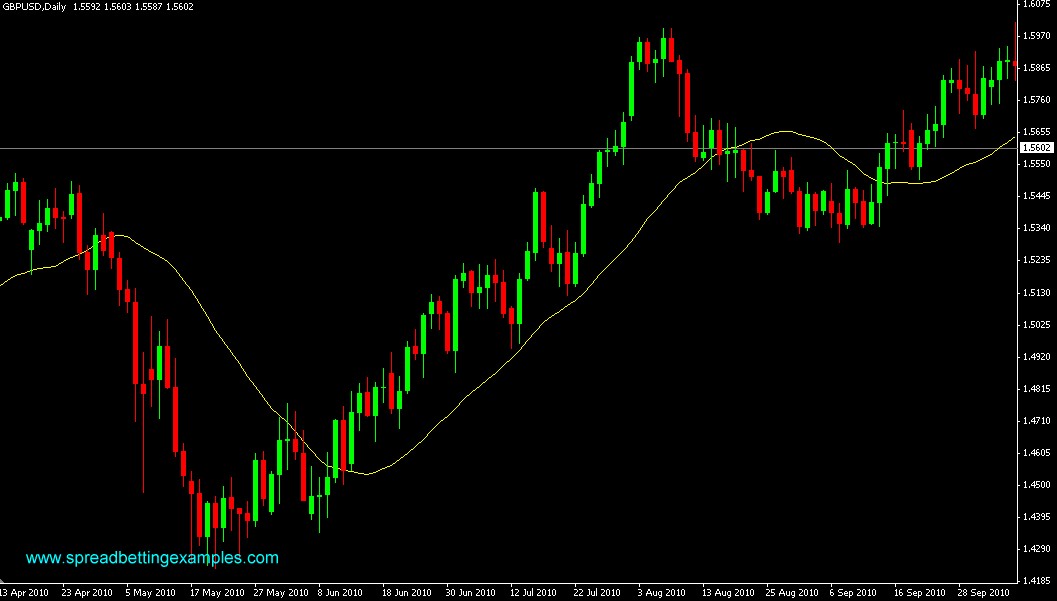
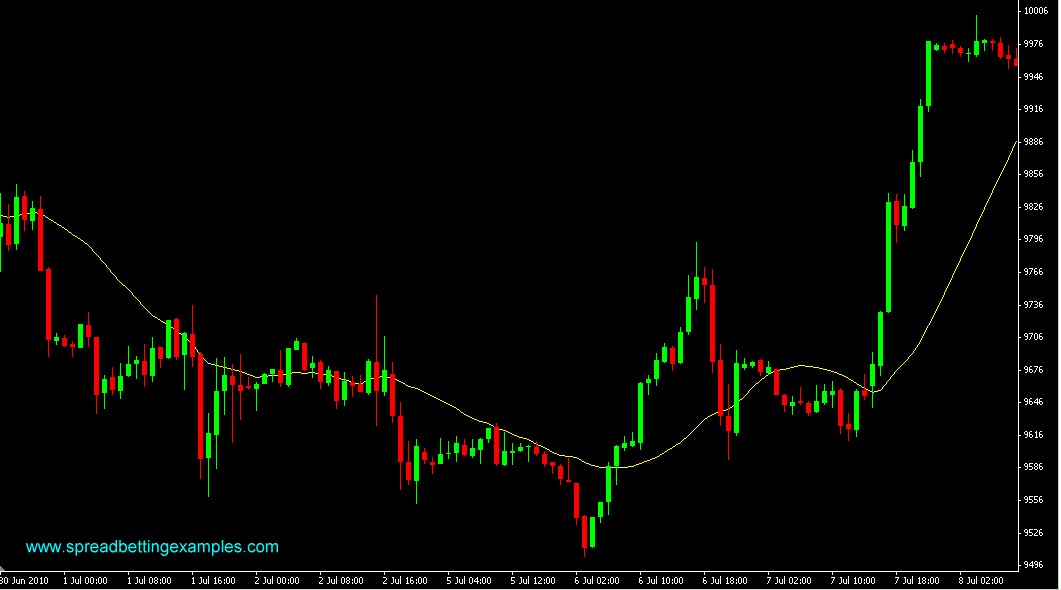
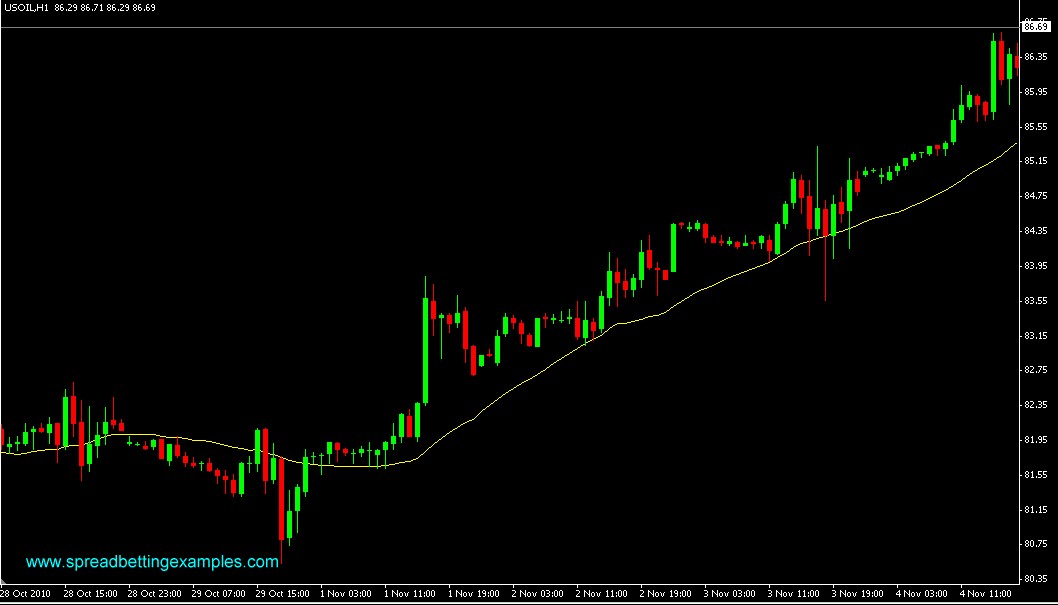
Trading Indicators used: Simple Moving Averages 25 SMA (also widely used 200 MA, 100MA, 55MA)
Charts used: Any. Preference: Dow, GBP/USD, WTI Crude

Entry Rules:When the candlestick of the time frame you are trading closes above the Moving Average, You can take a long position in your online spread betting account.

If instead the candlestick of the time frame you are trading closes below the MA, take a short position in your online spreadbetting account.

Exit Rules: You can use your money monangement rules, that is placing a stoploss at a certain % loss of your accounts or once the trade has turned around a certain number of points. This is you discreation.

Others wait for a sell signal to change the position around. This will always keep you in the market. When the market is not trending you could suffer a lot of turn arounds.

Professional traders use Moving Average Breakout strategy to help them determine the trend. If the trading occurs above the Moving average. They prefer spread trading to the long side, and vice-versa. The most common and widely used Moving averages are the 200 MA, 100AM, 55 MA and 25 MA.

Advantages: You Spread trade with the trend. Going against the trend could put you in difficulty.

Disadvantages: The moving average is a lagging indicator, and it can put you late into a trend.

Spread betting Examples

25MAis on  GBP/USD Daily &  1hr on DAX and  WTI Crude