Scalping with Bollinger Bands


Scalping with Bollinger Bands

In this Spread betting strategy we I will show you how to scalp using the Bollinger Bands. You will need a bit of practice before you master the art of scalping and master one of the strategies that you pick.  To Learn to scalp takes time and discipline, and lets not forget a lot of patience. This is one of the biggest errors traders do, they become in patient when there are no trades. Well Lets get started. I have picked the EURUSD as it is one of my favourite pairs, but you can choose a pair that you know and like.

Before we move on, here are tips on How to Scalp: Learn one strategy and dominate the technique. Learn one or two pairs and know every characteristic movement of your pair.  Know what affects your market

Below I have used the EURUSD in our example as I like it as the average movement it does in a 15 minute time range is about 15 to 20 points, which is well within my risk tolerance. If you want a more volatile Forex spread betting pair, you can choose the GPBJPY or the EURJPY. they have more volatility, more action and at the same time more risk.

Bollinger Band Scalping Strategy:

Pair:  EURUSD
Time Frame: 5 Minutes
Indicator Bollinger Bands: 20 moving average with 2 standard deviation (Default settings)
Time: Evening

This strategy can be applied in both sideways markets and trending markets:

1) Scalping with bollinger bands in a Sideway Markets (Mean Reverting):

The very first thing is to Identify if you are in a trending market or a sideways market. If you master one currency pair you will know when the move is over and you are in a sideways market or a certain times most markets repeat their behaviours. I have taken the EURUSD after market hours, as to accommodate people that work. This strategy is a simple concept: When the moving average is at a flat angle, and the bands are getting smaller (squeezing), this is the ideal moment to trade. Trade in the direction of the previous trend. When the price reaches the top of the band sell it and wait for it to return (mean revert) to the middle of the band. When the prices reach the bottom of the band buy the instrument and wait for it to return to the middle of the Band.

Stop loss is 10- 15 points above or below the bands:
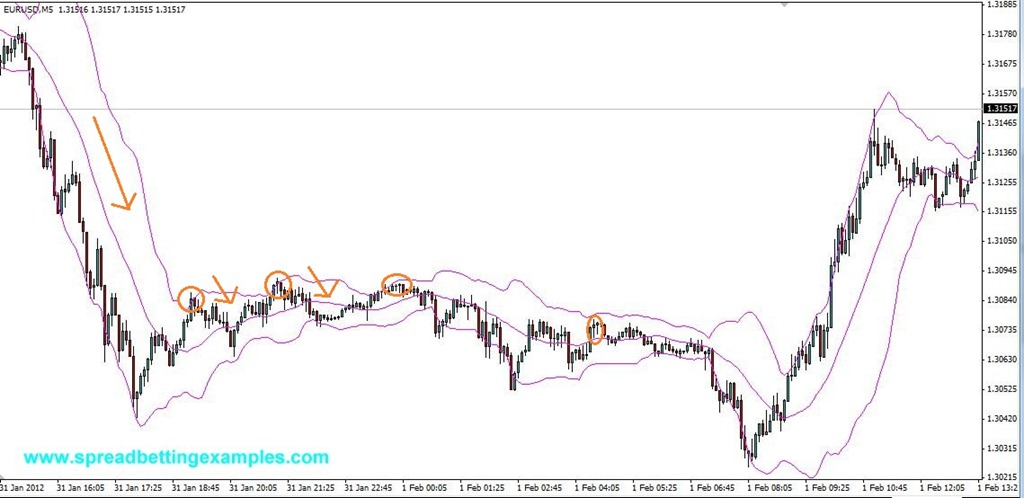
 

BollingerBand Scalping_Mean Reversion

Below is the same spread betting strategy applied to Rio Tinto. This to show how the same strategy can be traded in different markets
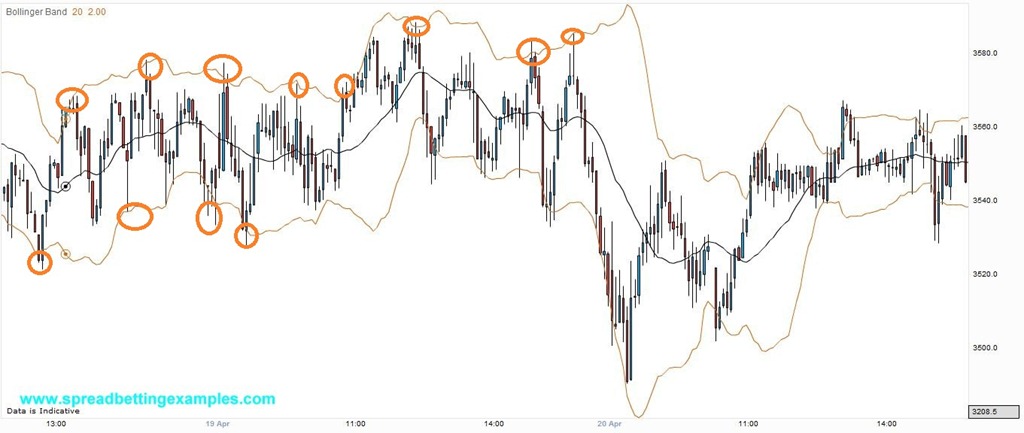
BollingerBand Scalping_Mean Reversion_Rio-Tinto


2) Scalping with bollinger bands in a trending Markets – Scalping the Pull Back:

On the other hand there has been strong news in the market you are trading it has started trending, (Note the trend is under way already), In this scalping strategy you trade the pull back. When the EURUSD moves up or down in the direction of the trend. You wait for the price to pull back to the centre line, the 20 day moving average, then you buy or sell in the direction of the trend.  In the spread betting example below when the prices pull back to the centre line, you buy with stoploss below the bottom band / line and with the take profit or target when the prices reach the top band again.
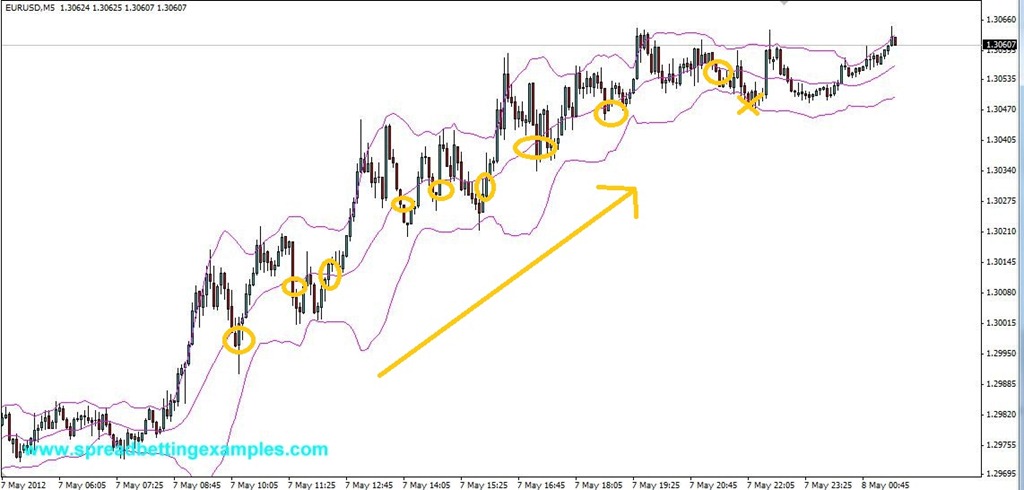
BollingerBand Scalping_Scalping the Pull Back


Below is the same spread betting strategy applied to Rio Tinto. This to show how the same strategy can be traded in different markets.
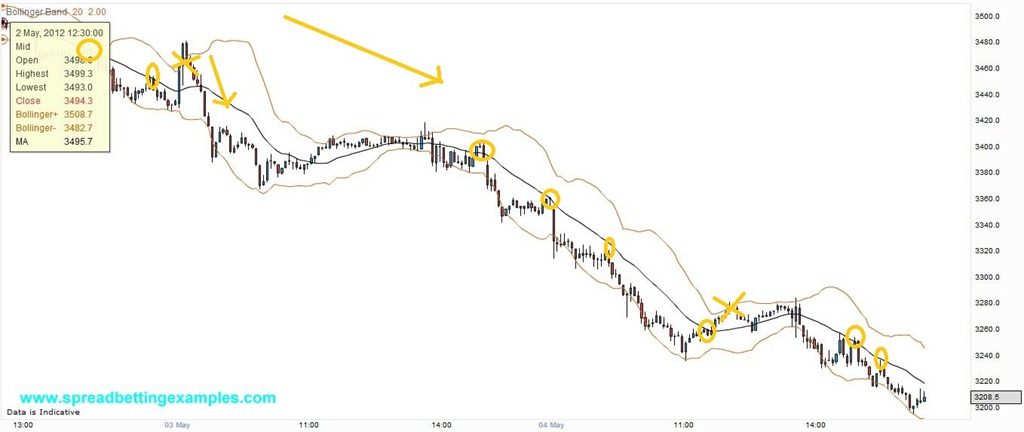
BollingerBand Scalping_Rio_Tinto


I hope You have enjoyed this . If you would like more ideas you can go to the scalping strategy section. Or you can return to the .

Gold trading strategy

Gold trading strategy

Well Now that you have just gone through the Gold spread betting example , I will now show you two different Gold Trading strategies. Gold like many commodities are still traded using Pivot Points.

There are two types of strategies one can use to trade gold. They are both commonly used but the trick to success is know what kind of market you are current in.  Well I guess this applies to all strategies. Let me elaborate further, If there has been strong news in the market regarding inflation, prices on commodities or about the economy not doing to well, many will find refuge in Commodities, as especially gold, is seen as a safe have. In this case Trading a commodity break out strategy would be beneficial. You could expect to trade a Gold break out strategy even if there is economic data or if Ben Bernanke is speaking and you expect the data or Bernanke to speak about quantative easing. This will probably affect the gold market. In this case you are anticipating a dramatic move in the Gold market and thus can use the Gold Break out trading strategy. As you can see from the Graph below, this would mean taking advantage of sudden movements like the one below.

Gold Break Out Strategy

Gold Spread bet example

Gold Pivot Point Strategy

Instead if on the other hand there is no news expected in Gold, or the market has already made  a drastic move and the commodity is currently retracing, You can use a Gold retracement strategy, Using Pivot points to trade Gold.

Gold Trading Strategy


Next: Gold Break Out Strategy

Gold Pivot Point Strategy

Home:

CCI -1 Min Scalping System

CCI -1 Min Scalping System

This is Forex spread betting scalping strategy, I have used it on an MT4 but can also be applied to other charts
Trade From 8am UK time to 16 UK Time

Time Frame: 1 min

Forex Spread Betting Rules:

Trade Long:
Indicator: CCI (170)
Wait for the CCI 170 to cross the 0 Line showing an uptrend. It must be the first indicator to cross.
Indicator: CCI (34)
Wait for the CCI 34 to cross above the 0 line, also showing an uptrend. This must be the  second indicator to cross in the same direction as the CCI 170
Indicator: RSI
Price must be above the 14 Moving average

Trade Short: (opposite to the above)
Indicator: CCI 170
Wait for the commodity Channel Index (CCI) 170 to cross below 0 line, showing a down trend, and again t must be the first indicator to cross.
Indicator: CCI 34
Wait for the commodity Channel Index (CCI) 34 to cross below 0 line, showing a down trend, and again t must be the second indicator to cross.
Price must be below the 14 Moving average

Settings:
CCI 170 PERIOD 170
CCI 34 PERIOD 34
Moving Average 14

Important: This system relies heavily on support resistance, Fibonacci levels and pivot points. so if you are near near a support and resistance line, wait to see what the price reaction will be. Wait to see if prices break the support and resistance or bounce off these levels. Always follow the trend and look to buy and tops and bottoms.

Forex Spread Betting Examples of the CCI -1 Min Scalping System applied to the EURUSD:

CCI -1 Min Scalping System

In the spread betting example, you can see I only took the longs trades as only in the long signals did the Commodity Channel Index 170 cross above the 0 line before the Commodity Channel Index 34


I Thank Canadian Dude for inspiring this Forex Spread Betting Strategy.

Back to

Doji Candlestick

Doji Candlestick

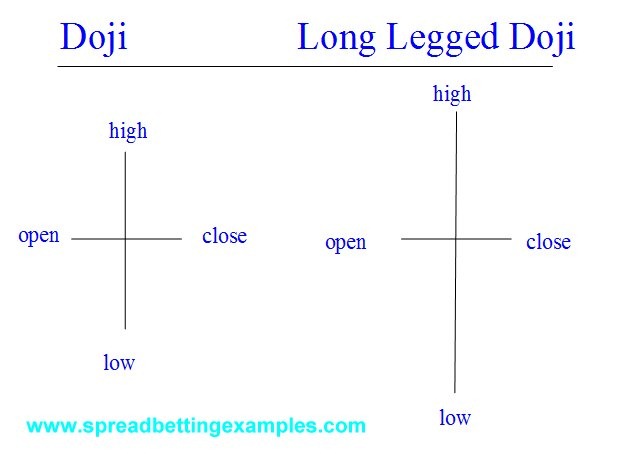
A doji is a very strong candle it show a lot of indecision between the bulls and the bears. Often a Doji is sign of reversal but can also be sign of a continuation. Doji’s are normally found at the bottom of a downtrend. Doji refers to both singular and plural.

The formation of the Doji is when the opening and closing price are the same. When the shadow of the Doji is extremely long this type of Doji is called a long legged doji. Then we have the “Rickshaw Man” which is also a Doji but the difference is that the Rickshaw Man has the opening and closing in the middle of the candle.

The Doji represents indecision, as the bears push prices higher, but then the bulls come in and fight prices lower to then end up at the starting point or opening price.

Doji


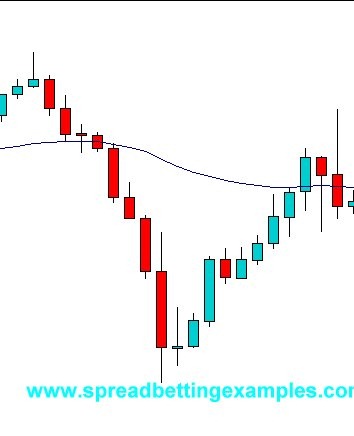
Below is a of a Doji formed in a down trend. As you can see the prices were heading lower until the bears started running out of steam and the bulls took over at the end of the downtrend but were pushed back closing in line with the opening price. The following candle the bulls give it a second chance to gain ground and start pushing prices higher. When a Doji manifests it’self this is a reversal warning signal that there might be a change in trend. This signals either to start scaling down on your position, closing your position or to monitor and be on the alert of a price trend change.

The Doji, is a strong indecision candle but not necessarily a reversal candle, hence it is more a warning candlestick than an actual reversal signal.

Forex Spreadbetting Doji on AUDUSD

Doji_1

While looking at your spreadbetting charts always keep an eye out for the Doji. You can also implement this in a spread betting strategy, but do keep in mind that it is more a warning sign than an actual reversal pattern. Now that we have seen what is a Doji, let’s look at intra day how it is formed.

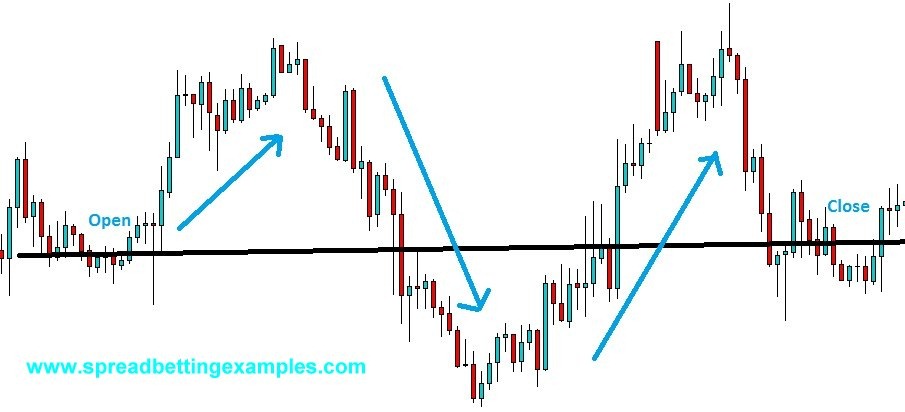
This is a spread betting example of the Doji intra day. There are many ways of forming a Doji.

Doji_formation

Prices opened the day after the overnight drift, heading higher, but soon the bears came in pushing prices lower continuing with the main trend down. Prices make new lows but these lows are defended buy the bulls that push prices higher to then return to the opening price.

There are other powerful Doji Patterns

  • Dragonfly Doji
  • Gravestone Doji


Go back to spread betting candlesticks

Alligator Scalping system

Alligator Scalping Strategy

Time frame: 5 Min

Tag: GBPUSD

Indicators used / Settings:

Exponential moving averages

Yellow: Pink:
Ema 3
Ema 5
Ema 7
Ema 9
Ema 11
Ema 13
Ema 21
Ema 24
Ema 27
Ema 30
Ema 33
Ema 36

Ema 55 Color Red

Possible other spread betting charts:

********************************

Spread Betting Example

Entry Rules:

When the yellow bands cross the pink bands this is your entry signal. I will present this strategy in two ways, for those that are risk averse and for those that don’t mind risk.

Spread-betting long:

Trade Long when the yellow bands cross the pink bands to the upside.  The cross over of the bands should occur above the 55 EMA line.
Risk averse: The above strategy could lead to some false entries as you can see in the second diagram. For those spread betters that are risk averse,  trade the rebound: After prices have broken to the upside, wait for the , that is prices to come back down into the pink bands  then trade long.

Spread-betting short:

Spread betting short is the opposite. Trade short when the yellow bands cross the pink bands to the downside.  The cross over of the bands should occur below the 55 EMA line.  for those risk averse

Exit Rules:

This is a scalping strategy, therefore keep to your money management rules.
on GBPUSD: use a target of 5-10 points and a stop loss of about 15 points. These targets could change according to what you are trading, You should determine your money management rules.

********************************

*best time for this strategy is on the European open or after a move has started.

*******************************

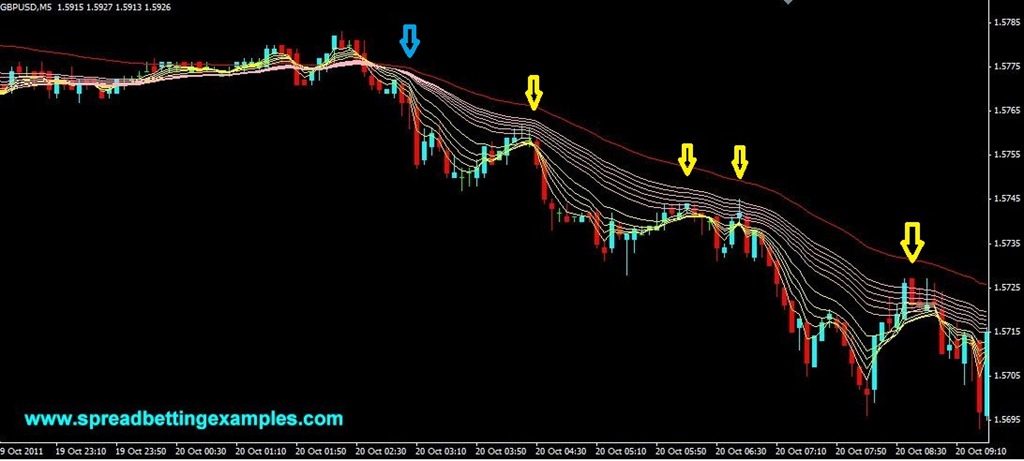
Here is a spread betting example of the Alligator Scalping system strategy on GBP USD

Arrows indicate entries. the risk averse spread betters would only scalp the yellow arrows.

Alligator Scalping


Here is an example of the disadvantage of this system. you might get false break outs.  A risk averse trader will avoid these false breakouts, as he trades only the retracements (indicated above by the yellow arrows).


Alligator Scalping_2


Below the spread betting example shows various entries. and the red arrow is the trader being stopped out.

Alligator Scalping_3


Back to

ADX and Bollinger Band

ADX and Bollinger Band spread betting strategy

Time frame: 5 Min

Indicators used / Settings:

(14)

(20, 2)


Charts used: FTSE 100

Possible other spread betting charts:GBP

********************************

Entry Rules:

When the ADX is above 25, this indicator tells you that a trend is underway. The whole point of this scalping  the FTSE strategy, is to find moments when there is no trend and the FTSE 100 is trading sideways or is consolidating after a move.  The whole purpose of this is to be patient. Once the FTSE 100 is consolidating you apply a mean reverting spread betting strategy. 


Spread-betting long:

When the ADX is below 25, as the UK100 has stalled after a strong trend, or there is no news and the FTSE is trading sideways. Wait for the prices to drop and touch the lower band. As you see the prices reversing going back up towards the middle 20 moving average line, spread bet  long.

You don’t want the price to break the band and close below the band. If the current candle closes below the lower band wait for the first candle to close back above the lower band. Then trade long.


Spread-betting short:

Again the ADX is below 25 and the FTSE is trading sideways. Wait for the prices to move up towards the upper band. As you see the prices reversing going back down towards the middle 20 moving average line, spread bet  short.

Ideally you want the prices to touch the bands and move lower / higher. If the prices close above the bands wait for the next bar to close inside the bands.

Strategy does require patience.


Exit Rules:

This is a scalping strategy. Use 5 – 10 point profit and 10 – 15 point stop loss.

stop loss: 15

target: 5-10

********************************

Here is a spread betting example of this ADX and Bollinger Band strategy applied to the FTSE100


FTSE 100 - Scalping 5 Min ADX BB


In the spread betting example below of the uk100. Prices did bounce off the lower Bollinger band, but failed to move higher. Be careful when prices do not follow through past the middle SMA heading towards the top band. , could indicate a change in trend.

FTSE 100 - Scalping 5 Min ADX BB_2

This spread betting strategy can also be applied on :

FTSE, DJI, GBP, Oil

Back to spread betting scalping strategies

5 Min GBPUSD

Time frame: 5 Min

Indicators used / Settings:

  • Parabolic SAR : (0.1, 0.11)
  • Moving Average : SMA 20
  • MACD:(5, 8, 9)

Charts used: GBP

Possible other spread betting charts:

FTSE 100, DAX, EURUSD

********************************

Entry Rules:

Spread-betting long:

The Parabolic SAR will give you the direction. Therefore you wait for the Parabolic SAR to be below the price. When you see the candle stick bar close above the moving average and The MACD histogram is above the 0 line, this is an indication to spread bet long. You could be spread betting in the evening this trading strategy as the GBPUSD gives you enough movement also in the evening

Spread-betting short:

Going short is the opposite, wait for the Parabolic SAR to be above the price. When you see the candle stick bar close below the moving average and The MACD histogram is below the 0 line, this is an indication to spread bet long. You could be spread betting in the evening this trading strategy as the GBPUSD gives you enough movement also in the evening


Exit Rules:

stop loss: 12 point

target: 3 to 5 ticks target

This is a spread betting scalping strategy therefore the following money management rules apply. Use a 12 point stop loss and try scalp the market for 3 to 5 ticks target. how to determine if using 3 or 5 ticks? well if the moving average is sloping or not this will indicate if the pair is trending. in a trending market you could take more points out of the market in a quiet sideways market just look for 5 points.

********************************

Here is a spread betting example of this  scalping strategy:


Scalping Strategy- MACD-PARSAR-MA_2


Further spread betting examples / I spread bet this trading strategy at times on :

FTSE 100


Scalping Strategy- FTSE100 - MACD-PARSAR-MA


Fibonacci Arcs

In the spread betting example below you can see how the Fibonacci levels are used in a form of Fibonacci Arcs. As you can see the Arcs are the projection of the Fibonacci levels: 38.2% 50% and 61.8%

In the spread betting strategy below the 38.2% retracement and the 61.8% retracement proved to be strong support and resistance areas in King fisher.

The Fibonacci Arcs are applied in the same way the Fibonacci retracements are applied. Draw the line from the highest to the lowest point then the projections will show the retracement points. These arcs can be applied also to spread betting stocks, Indices, commodities and bonds.


KingFisher -Fibonacci retracement arcs_

Spread betting example of the Fibonacci Arcs applied to King fisher stock


Next Fibonacci Fans

Fibonacci

Fibonacci Retracements are ratios used to identify potential reversal levels. Trader’s use these to predict where support or resistance levels are. The most popular Fibonacci Retracements are 61.8% and 38.2%.

Fibonacci numbers were identified by Leonardo Fibonacci, represent ratios that naturally occurred in Nature. Fibonacci numbers are simply a series of numbers that when you add the previous two numbers you come up with the next number in the sequence. Here is an example:  1, 2, 3, 5, 8, 13, 21, 34, 55 

 1 + 2 = 3;    2 + 3 = 5;

The main ratio also known as the Golden Ratio or PHI is 1.618 or the inverse 0.618. (calculated: number divided by the previous number approximates 1.618  55/34 = 1.618 or the other way round 34/55  = 0.618). Fibonacci numbers occur in nature and in the various markets as Forex, Stocks, Indices and commodities. There are many tools that incorporate the Fibonacci levels:

  • Fibonacci Retracements
  • Fibonacci Arcs
  • Fibonacci Fans
  • Fibonacci Time Extensions

Fibonacci Retracements

FTSE 100 -Fibonacci retracement(1)

The Fibonacci retracement tool is the most popular tool used applying the Fibonacci levels. To use the tool, just place the high and low on the highest point and the lowest point of the move, with the 0 at the extreme point of the move. The Fibonacci retracement tool will then project the retracement levels, as you can see in the spread betting example above.

In the graph above of the Spread betting index FTSE 100, you can see various levels projected which have become resistance while the FTSE was retracing it’s downward movement. Here is a spread betting strategy where the resistance areas where the FTSE Index stalled and retraced and presented itself as good trading opportunities are: 23.6% to 38.2% to a strong 50% then to 61.8%.

Once one resistance broke, this level then becomes support. Note in the spread betting example  how 23.6% was initially resistance then became support, the same with the  50% level which became support and 61.8% resistance.


Next:

Bollinger Bands mean reversion strategy

As we stated in our previous page the Bollinger Band is created by two bands around the 20 moving average centre line, and these two bands are the 2 standard deviation. In statistics, the 2 standard deviation contains 95.4% of the price movement. Normally,  the price will move away from the centre line towards the extremes and then snap back to the middle (The mean) like an elastic band. This snapping back is a “mean reverting strategy”. So when to spread bet long or short?

Mean reverting Spread Betting strategy

Long:

When the prices move down towards the lower band, this is when spread traders will either go long to open a new position or buy to close out their short position.

Short:

When the prices move up towards the upper band, this is when spread betters will either go short to open a new position or sell to close out their long position.


Below is a spread betting example of Xstrata (XTA.l) and how to trade the bands:

Xstrata (xta) -Bollingerbands mean reverting strategy(1)


The bands can be traded in many ways, above I have showed you a spread betting strategy, on the next page I will show you something completely opposite. When trading this mean reverting spread betting strategy, aggressive traders would enter as soon as the prices touch the bands, instead less aggressive spread traders would wait for the prices to turn around look for a candle that closes in the direction they want to trade, then take the trade.

For example, (in a long trade) when prices are falling a less aggressive trader would look for the prices to touch the lower band and the next candle to finish up not down, above the band. Then the trader would enter the  trade long, following a long spread betting strategy.


Closing your trade. Some spread traders will close the trade when it reaches the mean (middle line – 20 MA) others will wait for the prices to reach the above band. This all depends on your risk tolerance


Next, as we said we will show you the complete opposite.

Next:

Previous: