Gravestone Doji

Gravestone Doji

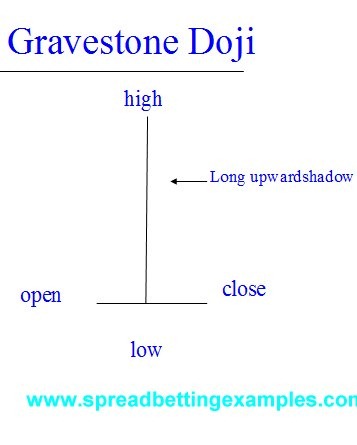
On the other hand we have the Gravestone Doji, which is a strong bearish candlestick pattern that occurs at the top of bull trend, often near the highs.
GravestoneDoji

The Gravestone Doji, as a typical Doji has it’s opening and closing at close to the same price. Rarely these two prices are the same price. However the most important feature of the Gravestone doji is that it has a long upward shadow.

This long shadow implies that the market tries to make new highs but find strong bearish resistance that push it all the way down to where prices started off, or opened. Therefore there is an overpowering of the bears over the bulls.

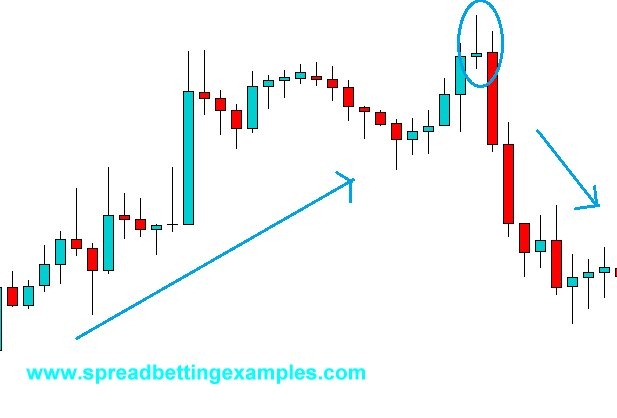
Below is a of the Gravestone Doji in a Forex EURUSD trade.
 

Gravestone Doji

As you can see prices were heading higher in an uptrend, slowed down, then tried to push higher until the bulls found bears defending the higher prices. These bears pushed the prices back to the candlestick’s opening price (gravestone Doji). The candlestick that followed was a strong bearish candlestick.

The Gravestone Doji is extremely helpful to indicate where there is strong resistance. If this resistance is broken we can find a substantial move higher.

In a spread betting system a trader would wait for the following bearish candlestick after the Gravestone Doji, as confirmation of the trend reversal. It is important to use a confirming candlestick. Some more aggressive traders would enter as the Gravestone Doji is formed; maybe with smaller stakes taking on smaller risks.


Back to

Back to candlestick patterns

5 Min GBPUSD

Time frame: 5 Min

Indicators used / Settings:

  • Parabolic SAR : (0.1, 0.11)
  • Moving Average : SMA 20
  • MACD:(5, 8, 9)

Charts used: GBP

Possible other spread betting charts:

FTSE 100, DAX, EURUSD

********************************

Entry Rules:

Spread-betting long:

The Parabolic SAR will give you the direction. Therefore you wait for the Parabolic SAR to be below the price. When you see the candle stick bar close above the moving average and The MACD histogram is above the 0 line, this is an indication to spread bet long. You could be spread betting in the evening this trading strategy as the GBPUSD gives you enough movement also in the evening

Spread-betting short:

Going short is the opposite, wait for the Parabolic SAR to be above the price. When you see the candle stick bar close below the moving average and The MACD histogram is below the 0 line, this is an indication to spread bet long. You could be spread betting in the evening this trading strategy as the GBPUSD gives you enough movement also in the evening


Exit Rules:

stop loss: 12 point

target: 3 to 5 ticks target

This is a spread betting scalping strategy therefore the following money management rules apply. Use a 12 point stop loss and try scalp the market for 3 to 5 ticks target. how to determine if using 3 or 5 ticks? well if the moving average is sloping or not this will indicate if the pair is trending. in a trending market you could take more points out of the market in a quiet sideways market just look for 5 points.

********************************

Here is a spread betting example of this  scalping strategy:


Scalping Strategy- MACD-PARSAR-MA_2


Further spread betting examples / I spread bet this trading strategy at times on :

FTSE 100


Scalping Strategy- FTSE100 - MACD-PARSAR-MA


ZigZag – Practicle use

Not many spread betting platforms offer the ZIGZAG, but if you find it it does help in your analysis and projection. Example many Elliot wave chartists could use the ZigZag line to filter out noise when doing their count. The ZigZag settings to be applied is subjective o the individual doing the count, and how sensitive his count is to the price action.


FTSE 100 -ZIGZAG indicator_ElliotWave

As you can see from the chart above we have used the ZigZag Line to filter out just then main movements.


Filtering out Support and Resistance:

In the S&P 500 spread betting example, the Zig Zag line has filtered out support and resistance. We have used a 5% filter, therefore only when the spreadbetting price moves more than 5% will it determine important areas of price reversal or price continuation. Below I have pointed out the break of support.

After the price found new support it started forming an ascending channel that was eventually broken to the downside and the support line became new resistance.

S&P500- ZIGZAG indicator_Spreadbet

as you can see the ZigZag Line has helped also identify patterns. as in this case and ascending channel.

German Bund - tripple top pattern

to see how effective the ZigZag line is, look to the left of the triple top pattern. Can you see how effective the ZigZag Line was in maintaining you in a long spreadtrade, which would have allowed you to run your trade all the way to the top of the first peak.


In Conclusion. The Zig Zag Indicator is effective to help you identify chart patterns, support and resistance areas and help you stay in the path of the main trend.

Exponential Moving Averages

Exponential Moving Averages

The exponential moving average also known as the exponential smoothing. This indicator is the one preferred by technical analysts of the various different moving averages, as it is a balance between the simple moving average, that lags and the weighted moving average that is over sensitive.

The simple moving average gives more weight to the current prices. Therefore it’s advantage is that it is quicker and follows the prices better. The disadvantage is that it ism more prone to whipsaw than the simple moving average.

From the chart you can see the difference between the simple moving average and the exponential moving average.

FTSE 100 - Exponetial Moving Average

As you can see the Exponential moving average follows the FTSE 100 closer. The SMA (Simple Moving Average) is less sensitive to price movement.


Now I will show you a spread betting strategy of two moving average cross and how the two different  averages react.


FTSE INDEX - 2 Exponential Moving Average Crossover_b


FTSE INDEX - 2 Simple Moving Average Crossover_b

You can see above how the exponential moving average crosses earlier than the simple moving average. giving you an earlier short spread betting signal. But it also gives you an earlier signal to close out your trade.

when deciding which spread betting strategy to use. You must decide which moving average will fit your style of trading. You could also mix the two. using an EMA to enter and a SMA to exit.


Next:Weighted Moving average