FTSE 100 Example

Here is an Example of trading the FTSE. I will first show you how to calculate the your bet size and bet risk. Then in the second part I will show you What to look out for and show you various strategies applied to the FTSE.

FTSE 100 Spread Betting Example

Here is a example of the FTSE 100. In this example lets assume you have already decided that you will spread bet the FTSE 100 up.
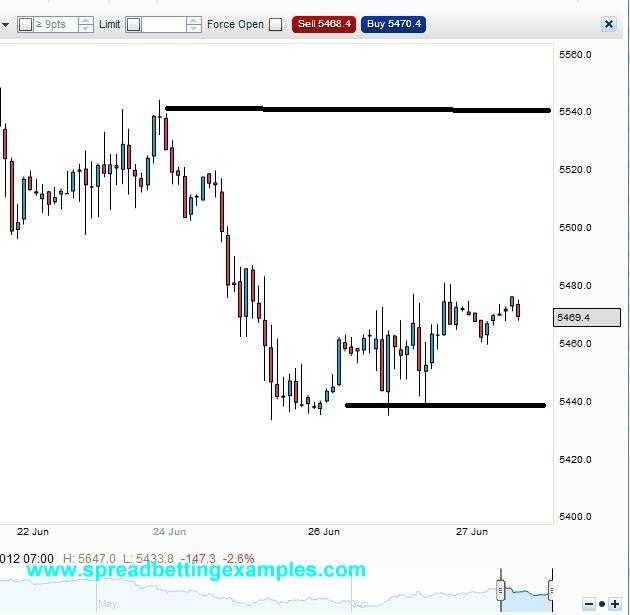
 

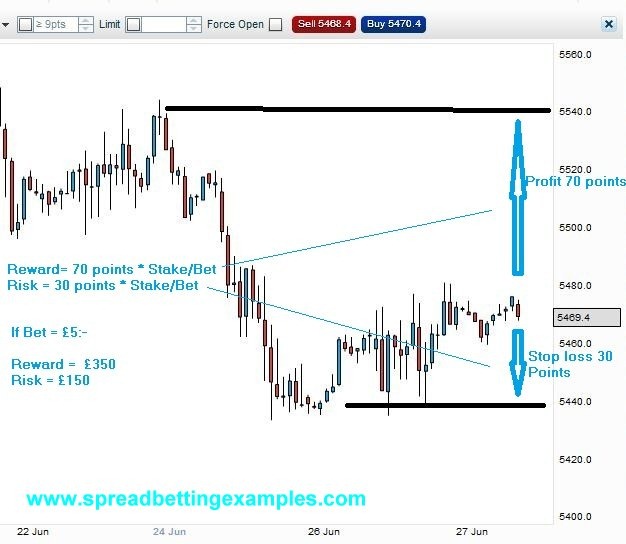
As you can see from the graph above the FTSE is currently trading at the spread price of 5468/70 with the mid price at 5469. In the Spread the price at which you buy is the offer price 5470 and the price at which you will sell is the bid, as you are selling to the buyers.
In this Example you believe that the FTSE will reach it’s previous high of 5540 but if it goes below 5440 you are happy to close your bet and cut your risk, take a loss.
Entry Long (current offer price) 5470
Profit Target (FTSE 100 previous high)- 5540
Stop Loss (FTSE 100 previous low) – 5440

-Limit price is 70 points above the current price and stop loss is risking 30 points.
-You decide you would like to Risk No more that 150 pounds, just to test your belief.
Stake (Pounds per point) = 150 GBP the amount you risking divided (by the points risking) 30 = 5GBP
-Your stake is 5Pounds a point. What this means is that for every point that the FTSE moves up or down you will loose or make 5 Pounds

If instead it goes in your favour all the way to 5540 + 70 points * 5GBP = your profit will be 350 GBP.
Risk reward Ratio: Your risk reward ratio is a min of 1:2. You are risking 150 to gain 350.

What is good practice is also to know the full value of your bet, well the full risk. This is only if the FTSE shuts down overnight and your spread bet looses the full of the FTSE 100 value overnight:
The Nominal value of the trade is £5 * £5470 = £27 350
FTSE Spread betting example_b

To further help you in your Spread betting example, you can read calculating your risk

or back to the spread betting example section.
Scalping with Bollinger Bands


Scalping with Bollinger Bands

In this Spread betting strategy we I will show you how to scalp using the Bollinger Bands. You will need a bit of practice before you master the art of scalping and master one of the strategies that you pick.  To Learn to scalp takes time and discipline, and lets not forget a lot of patience. This is one of the biggest errors traders do, they become in patient when there are no trades. Well Lets get started. I have picked the EURUSD as it is one of my favourite pairs, but you can choose a pair that you know and like.

Before we move on, here are tips on How to Scalp: Learn one strategy and dominate the technique. Learn one or two pairs and know every characteristic movement of your pair.  Know what affects your market

Below I have used the EURUSD in our example as I like it as the average movement it does in a 15 minute time range is about 15 to 20 points, which is well within my risk tolerance. If you want a more volatile Forex spread betting pair, you can choose the GPBJPY or the EURJPY. they have more volatility, more action and at the same time more risk.

Bollinger Band Scalping Strategy:

Pair:  EURUSD
Time Frame: 5 Minutes
Indicator Bollinger Bands: 20 moving average with 2 standard deviation (Default settings)
Time: Evening

This strategy can be applied in both sideways markets and trending markets:

1) Scalping with bollinger bands in a Sideway Markets (Mean Reverting):

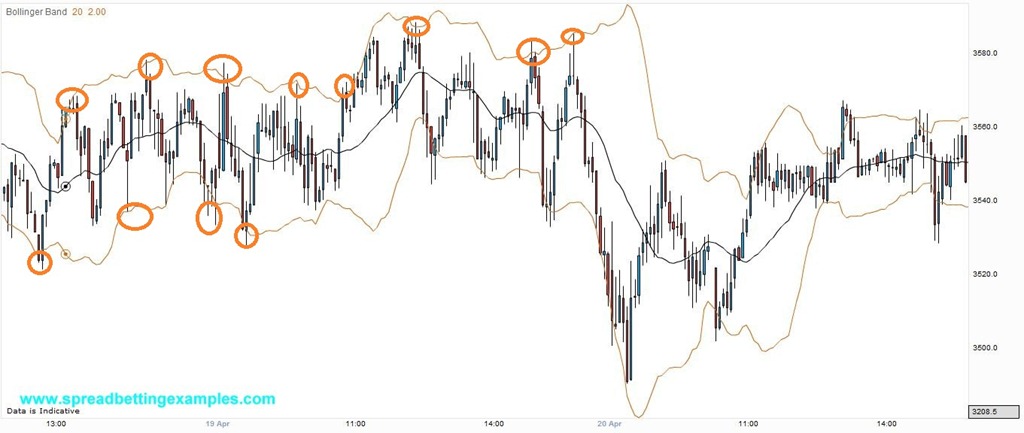
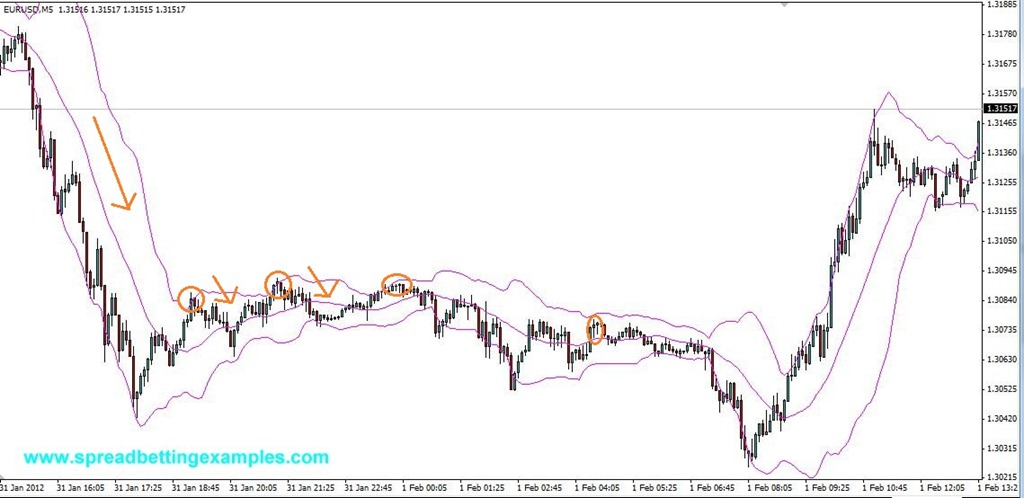
The very first thing is to Identify if you are in a trending market or a sideways market. If you master one currency pair you will know when the move is over and you are in a sideways market or a certain times most markets repeat their behaviours. I have taken the EURUSD after market hours, as to accommodate people that work. This strategy is a simple concept: When the moving average is at a flat angle, and the bands are getting smaller (squeezing), this is the ideal moment to trade. Trade in the direction of the previous trend. When the price reaches the top of the band sell it and wait for it to return (mean revert) to the middle of the band. When the prices reach the bottom of the band buy the instrument and wait for it to return to the middle of the Band.

Stop loss is 10- 15 points above or below the bands:


BollingerBand Scalping_Mean Reversion

Below is the same spread betting strategy applied to Rio Tinto. This to show how the same strategy can be traded in different markets

BollingerBand Scalping_Mean Reversion_Rio-Tinto


2) Scalping with bollinger bands in a trending Markets – Scalping the Pull Back:

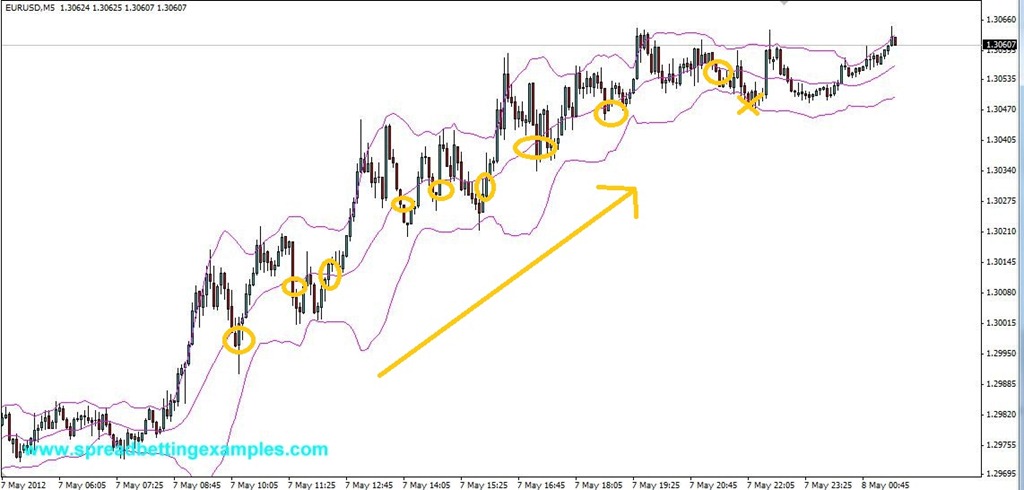
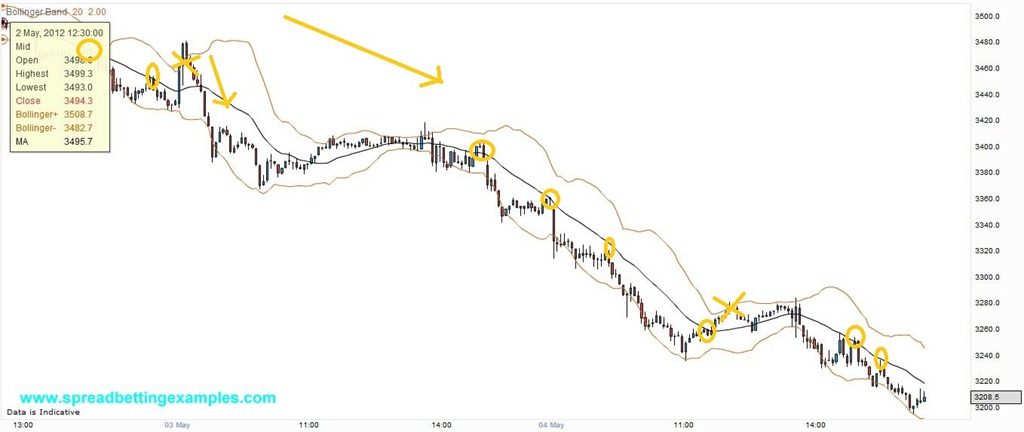
On the other hand there has been strong news in the market you are trading it has started trending, (Note the trend is under way already), In this scalping strategy you trade the pull back. When the EURUSD moves up or down in the direction of the trend. You wait for the price to pull back to the centre line, the 20 day moving average, then you buy or sell in the direction of the trend.  In the spread betting example below when the prices pull back to the centre line, you buy with stoploss below the bottom band / line and with the take profit or target when the prices reach the top band again.

BollingerBand Scalping_Scalping the Pull Back


Below is the same spread betting strategy applied to Rio Tinto. This to show how the same strategy can be traded in different markets.

BollingerBand Scalping_Rio_Tinto


I hope You have enjoyed this . If you would like more ideas you can go to the scalping strategy section. Or you can return to the .

Mean Reverting

Mean Reverting

Mean Reverting refers to theories that say price will normally return back to their mean or average. In Statistics, the mean or average is the average price over the last n days (Days you have chosen as average).

A is widely used when spread betting with the Bollinger Bands. Here is a .

Commodity Channel Index (CCI)

Technical Indicator: Commodity Channel Index (CCI)


The Commodity Cannel Index (CCI) is a very popular indicator used mainly to show overbought and oversold areas. Developed by Donald Lambert mainly for commodities, it is not used on a wide variety of products. The CCI measures the current price relative to an average price, usually 20 prices. These have been created so that between +100 (overbought) and -100 (Oversold) they represent 75% of the price movement.

Often found on most spreadbetting charting packages as there is no volume involved. It is very easy to apply to your spreadbet charts.


Next Page:Trading the Commodity Channel Index (CCI)

Welcome to Spread betting examples

Welcome to spread betting examples this site is meant for those spreadbetting traders that have some knowledge of what financial spread betting is, to help generate other trading ideas.

If you are new to spread betting don’t worry, we will also link or give full explanations of how to spread bet and of  what various technical analysis  terms mean.

We put together our trading knowledge  and other people’s knowledge into this site.

You will find here also the abc of trading, with many different trading styles like, Scalping,   Day trading,   Swing Trading,   Long term trading.  The website is also rich of examples in Financial spread betting  Indices,    Shares Commodities,   Oil,    Gold,   FTSE,   Dow,   Dax, forex, EUR/USD,   Gbp/usd and much more.

I hope you enjoy the tips and ideas, feel free to share your strategies too.

SB