How to trade the Nonfarm payrolls

How to trade the Non-Farm Payrolls. Many ask themselves how do you handle such volatility. Well I guess non farm payrolls is more for the experienced traders, the volatility traders and the more “bavado traders” . For traders that make consistnt money with systematic repetitive trades during the course of the month, the Non-Farm Payrolls, they will normally sit out of the session.

Having said that, there are safe ways of trading the Non-farm payrolls. You need to be extremely disciplined, and try not get lured by the gamble of having a little “punt”.

First  will explain to you How to trade the NonFarm Payrolls, then i will show you three examples, of a successful trade and two different types of No trading sessions.

1) How to trade the NonFarm Payrolls?

This is a strategy that I have used and have found that it is useful. It works on understanding what the traders’ and analysts expectations are and see if the data is better or worse than expected.
Volatility trade, trade it with a currecy pair: eurusd – liquid
gbp/usd
gbp/jpy – for those looking for a big break out.

so First you analyse the data.

Then you gather what the analysts expectations are in the market. this can be found on bloom berg or a forex news site

then you set your self a .20% deviation from the consensus, if this is broker you will get a certain reaction.

If The Data comes out worse or better than expected the currency pair you are trading will move strongly

Ok so lets run through an example.

During the Non-Farm Friday session there are two economic data that will affect the trade, the Non-Farm Employment Change and the Unemployment rate.

Using the VIX index as a trading indicator

Using the VIX index as a trading indicator

A Stable Market is considered when the VIX index is below 20 or 25. You can use the VIX index as a trading signal by picking up trades when then VIX index goes above these levels. Historically the Vix index would reach 20 and turn back down seldom would it reach 25. By applying good money management you could take advantage of these panic situations ad buy the S&P 500 when the VIX Index rises above 20 and turns back down the next day. Historically this has worked, but as we can see for the past thing can change in the markets. Always trade with caution.

spreadbetting-Vix-trading-indicator

spread betting SP500-trading-indicator

How I use the VIX

How I prefer to use the VIX index is more as a warning sign. I have strategies that i follow during normal market conditions which are simple repetitive actions everyday, but when the market conditions change and the markets become more volatile I will also change my style of trading, I would look for more spike trades. Change my trading style. i might feel maybe I should stay out of the market altogether. This depends from how volatile the markets are.

I hope this has been useful if you would like to share your point of view write a comment i will answer as soon as possible.


Back to: Vix Index

Back: Spread betting basic strategy

VIX – Volitility Index

Vix Index and VXN Index

The VIX is a an index of the Chicago Board Options Exchange, used to measure Market Volatility. This is a popular measure of the implied volatility of S&P 500 index options. The Vix is widely followed as it is referred to as the fear index or the fear gauge, it gauges what the market expectations are over the following 30 days. The higher the volatility, or the higher the VIX index rises the more uncertainty there is in the market of where prices are going or what will happen in the market, therefore the more irrational and volatile prices will be.
The $VIX Index measures the implied volatility of the S&P500 on the other hand there is the $VXN which measures Nasdaq 100 Index Options.

Some traders identify an inverse relationship between falling prices and the rising VIX Index. Below is a screen shot of Yahoo Finance the VIX index and the SP500. The picture below these two Diagrams I overlap the charts.

Spread Betting VIX

Spread Betting SP500

Here I overlap the two charts, you can Notice the Inverse relationship.

VixIndex

You can find the VIX index on Yahoo finance with this symbol: (^VIX)

The fact that this inverse relationship exists is because prices move slower up than they fall. While moving higher prices will consolidate then continue their move higher. Instead when prices fall the markets are overwhelmed by people trying to get out of stock, to safeguard their investments, because of ad news that has come out or that has spread in the markets. In the markets moving falling prices ranges are wider, thus also a bigger volatility.

You will notice that the average daily price range in a falling market is much wider that in a rising market, these bigger movements explain  the greater volatility too.

Next:Using the VIX index as a trading indicator

Back: Spread betting basic strategy

Useful Links/Trading Resources

News

To those that use resources but are looking for other resources, here is a list of resources I use. Feel free to place a comment on your useful resources. For those that are new to the markets some websites might be too complex to follow, but all I suggest is to follow and read them routinely. The information will soon make sense.

What I read and use to follow the markets:

image

FTAlphaville is an part of the FT, and it gives very useful insights to the market. They also have the 6am cut that is a newsletter that is sent out free and summarizes all the useful information you need for the day.

bloombergWell I guess you all know Bloomberg. Bloomberg TV used on all trading floors around the globe, very useful to give you a deep insight of the markets. Bloomberg is more for general analysis. When you are new to trading, sometimes it is a bit too complex, but just keep reading.

imageZero Hedge– is very analytical and gives a lot of useful insights to behind the scenes


Reuters: Here is another useful website. what is useful about Reuters is that is is more for traders. In the morning Reuters offers a great daily market information.

For those of your that follow commodities: Search for PRECIOUS
For those of your that follow ForexSearch for Forex
For those of your that follow Fixed Income Search for Treasuries
For those of your that follow the stockmarket Search for Factors

reuters

SquawkBox

I personally use Ransquawk, they also have very insightful market wrap videos and market summaries

Videos:

Ransquawk

Technical analysis Newsletter:

ActionForex

Action Forex

Trader 24 Newsletter deals with the South African market but also analysis the FTSE, DJI, and Gold

Trading example of the Aroon Indicator on BHP Billiton LTD

Trading example of the Aroon Indicator on BHP Billiton LTD

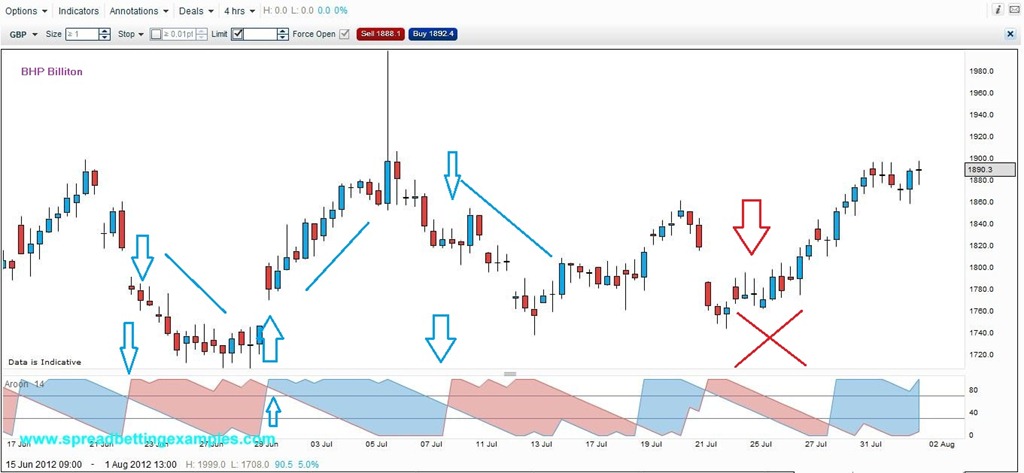
Here is a spread betting example using the Aroon Indicator on BHP Billiton. The Aroon indicator is more of a confirmation tool than an entry and exit tool, as it lags the change of Direction.  It has a similar  behavior to a moving average. Moving averages only tell you that the market has turned, after it has turned. On the other hand the advantage of a lagging indicator is that if a trend pics up it is the best tool to keep you in the trend even if short term retracements arise in the main trend.

Period 14: Having said that lets return to our example. In the Aroon Indicator I have applied this on BHP Billiton, a mining company. I have used the default settings that are given by the graph, that is a period of 14 days. The higher the period, the longer it will keep you in the trend but at the same time the later you will enter the trend.


Trade Short when the Aroon Indicator crosses and turns Red.

Trade Long when the Aroon Indicator crosses and turns Blue.

Pay attention you always want to see one of the Aroon indicator’s leg’s above the 70 line or below the 30. If both are in the middle, or between the 30 and 70 line, this is telling you that there is a lack of direction. Should stay out if your strategy is following the trend.

BHP-Billiton-Aroon-spread-betting


As you can see from the graph, where the indicator crosses downwards, changing the highlighted colour to red, this indicates a short trend is under way. You can see this highlighted by the first down arrow. As you can see, at this point the trend in BHP Billiton has already reversed and and the Aroon indicator has signalled it slightly late.

On the second up arrow indicates a long trend is underway. You can identify this by the Indicator turning blue in this spread betting example.

Instead where you see the red cross. The Indicator gives no direction as the lines narrow between the 70 and 30 mark.

The Aroon Indicator is a very helpful tool as it tells you in which Market you are trading and which tools to apply, trend following tools like the Moving averages or oscillators.

Back to simple Basic betting strategies

Basic strategy using the Aroon Indicator

Basic strategy using the Aroon Indicator

Many have emailed me and asked what was the Aroon Indicator in their IGIndex accounts, here is a simple explanation of the Aroon indicator and presented in a simple strategy.

The main function of the Aroon indicator is used to know when the market is in an upward or downward trend, or simply ranging. It is helpful to also define which strategy is right for the current market conditions.  Simply put, many strategies loose money in non-trending conditions, thus knowing (or at least having an indicator that informs you) when the market is trending or not can save many spread betters a lot of money.

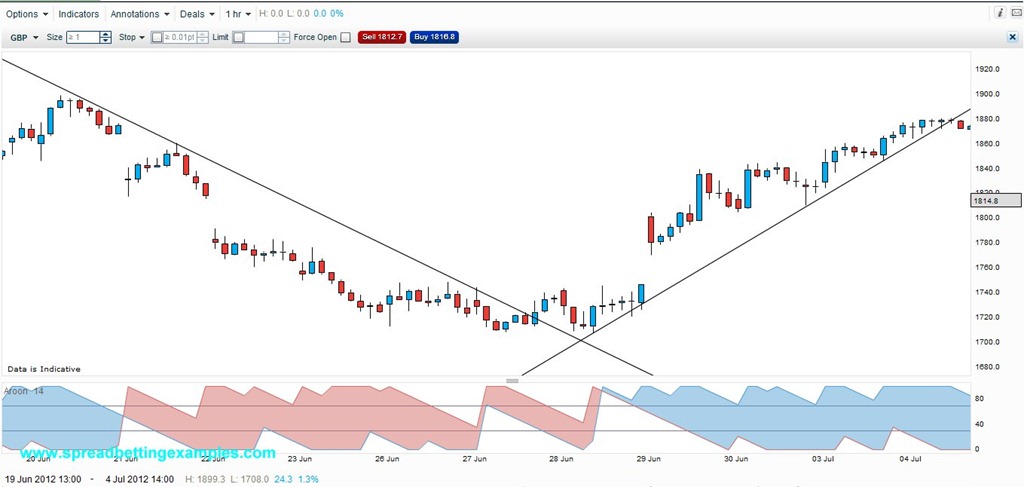
Below is a spread betting chart of BHP Billiton, using the Aroon Indicator. This is an hourly chart taken over the last two weeks. In the chart I show how the Aroon Indicator was able to capture one full week of downtrend and one full week of uptrend:

IGINDEX-Aroon-Indicator


How to Interpret the Aroon Indicator

If you look closely to the Aroon Indicator you will see that it is made up of a red line and a blue line. On the chart you will notice also the 70 and 30 horizontal line. When the Red line is above the 70 line and the blue line is below the 30 line, this indicates that the markets are in a downward trend.

Instead when the Aroon Up Indicator, the blue line, is above the 70 line and the Aroon down Indicator, the red line, is below the 30 line then the market is trending Upwards. 

When both the Aroon Indicators are in the centre of the trading chart then this means the market is consolidating.

The default setting of the Aroon Indicator in your spread betting account is 14 periods. This means it is 14 bars of the time frame you are looking at. f you increase the Time frame to 25, which is the By varying the period length, the Aroon indicator can give long term indications of trend or short-term indications of trend. By default, the Aroon indicator is 25-periods, the more you increase the periods the longer trends you will spot.

But pay attention: the longer the time frame, the less sensitive it is to a changing trend.

On the other hand if you decrease the time frame it will react quicker to changing trends but it could miss out on long trends, showing you more trades and changes of direction.

The Aroon indicator measures how many periods since the price recorded a x-period high or low. The Aroon-Up and Aroon-Down are two separate indicators and measure: (As per the 14 period setting in your IG account) Aroon-Up measures the number of days since a 14-day high; and 14-day Aroon-Down measures the number of days since a 14-day low.

The Aroon indicator is unique as it focuses on time relative to price, unlike the typical momentum oscillator.

Here is a simple spread trading example of how to trade the Aroon Indicator

Trading for a living – Alexander Elder – Review

Trading-for-a-LivingThis book was one of the first books I read, or better it was the second book. The first was an introduction on technical analysis. I have placed this as one of the earlier books to read as this book will give you a general understanding on all the facets of trading from technical analysis to money management to trading psychology.

I really enjoyed it. Dr. Alexander Elder did inspire a bit of my earlier trading techniques. The Strategy he offers is simple and based on the MACD. I guess at times simplicity is key.

He gives a deep explanation of many technical indicators like the: moving averages, MACD, directional system, new high-new low index, etc.

He also introduces his own two indicators: Elder Ray and Force Index. Elder’s techniques are based on Volume and momentum. Volume is very important in markets.

In Trading for a living, he also introduced the Triple Screen trading (using three timeframes) method which was very insightful, which is a general trading method recommended.

He does go into trading psychology,  Dr. Elder is a psychiatrist by profession and this helps him capture and explain the psychological of trading, how difficult trading psychology is, the roller coaster of emotions, and how often traders  “marry” to their losing positions afraid to close them, in hopes for a reversal.

He goes further to explain how no great money management technique can help a loosing system, but poor money management can make any good strategy loose.

I really enjoyed this book at the beginning of my trading. If you are looking for explanations on all aspects of trading, this is a nice read.

FTSE 100 Example

Here is an Example of trading the FTSE. I will first show you how to calculate the your bet size and bet risk. Then in the second part I will show you What to look out for and show you various strategies applied to the FTSE.

FTSE 100 Spread Betting Example

Here is a example of the FTSE 100. In this example lets assume you have already decided that you will spread bet the FTSE 100 up.


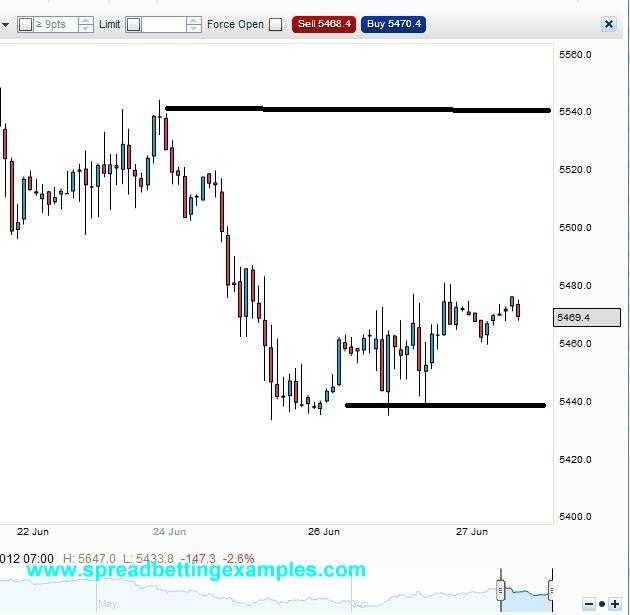
As you can see from the graph above the FTSE is currently trading at the spread price of 5468/70 with the mid price at 5469. In the Spread the price at which you buy is the offer price 5470 and the price at which you will sell is the bid, as you are selling to the buyers.
In this Example you believe that the FTSE will reach it’s previous high of 5540 but if it goes below 5440 you are happy to close your bet and cut your risk, take a loss.
Entry Long (current offer price) 5470
Profit Target (FTSE 100 previous high)- 5540
Stop Loss (FTSE 100 previous low) – 5440

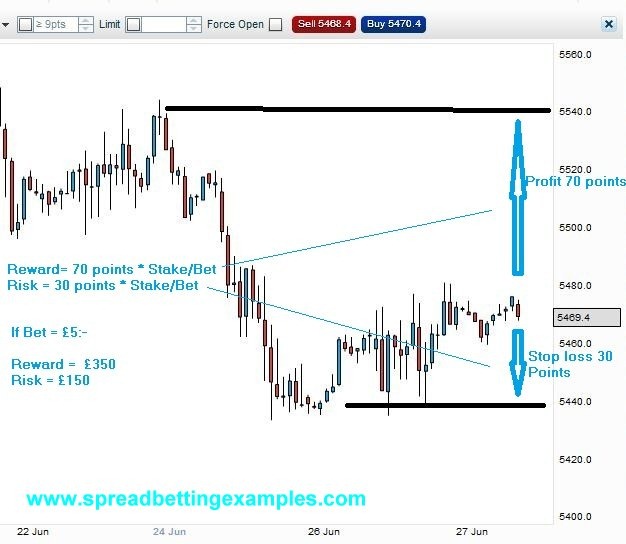
-Limit price is 70 points above the current price and stop loss is risking 30 points.
-You decide you would like to Risk No more that 150 pounds, just to test your belief.
Stake (Pounds per point) = 150 GBP the amount you risking divided (by the points risking) 30 = 5GBP
-Your stake is 5Pounds a point. What this means is that for every point that the FTSE moves up or down you will loose or make 5 Pounds

If instead it goes in your favour all the way to 5540 + 70 points * 5GBP = your profit will be 350 GBP.
Risk reward Ratio: Your risk reward ratio is a min of 1:2. You are risking 150 to gain 350.

What is good practice is also to know the full value of your bet, well the full risk. This is only if the FTSE shuts down overnight and your spread bet looses the full of the FTSE 100 value overnight:
The Nominal value of the trade is £5 * £5470 = £27 350

FTSE Spread betting example_b

To further help you in your Spread betting example, you can read calculating your risk

or back to the spread betting example section.

Forex Spread Betting Simple Trading System

Forex Spread Betting Simple Trading System

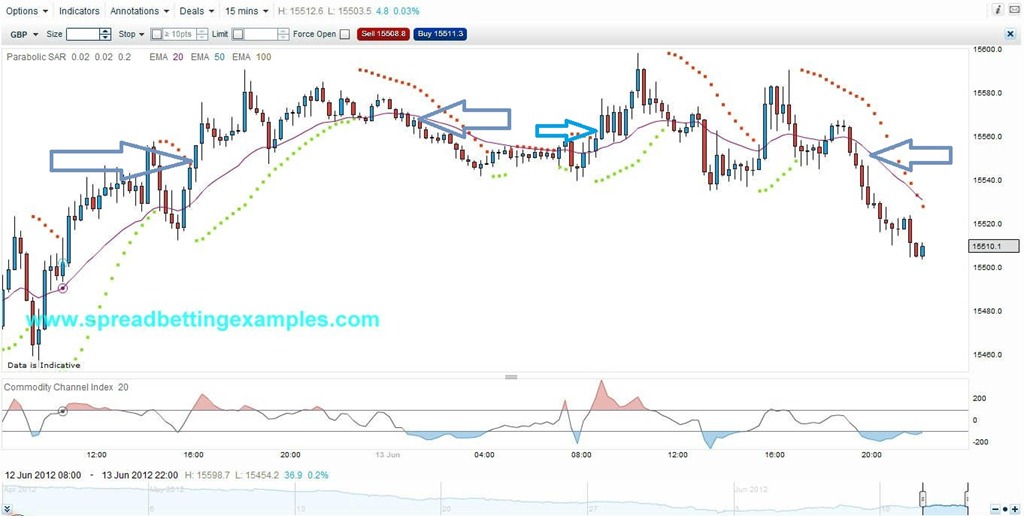
This is a Forex Spread Betting Simple trading System that is mainly used on the Pound or on the Euro. I will show you how I set up my Charts in My IG account and how to trade the system.

Setting Up the Charts: If you go the the options tab on the top right hand side, click on options. To the Chart you add:
Parabolic SAR default settings which are 0.2 /0.2
Exponential moving average of 20 periods
And the Commodity Channel Index, I use the default 20.

Below is a 15 Minute Chart

Forex Spread Betting Simple Scalping System_b

How to trade this system:

For those more experienced, use the parabolic SAR as your indicator to enter the trade or close your trade. Wait for the candle stick to complete.

For those less experienced – wait for the Parabolic SAR to give you a sell or buy signal. You wait for the price to cross the moving average. The moving average acts as your confirmation tool. If both signals don’t occur don’t take the trade.  For Example:  In the graph above in the first arrow you can see the Parabolic SAR gave you a buy signal the prices have moved above the moving average, this is when you enter your trade. Your stoploss below the current candle to at least half way the distance of the previous candle. As prices move higher  trail your stoploss higher. For the more experienced traders, you can trade without the moving average.

Forex Spread betting simple trading system main rule: Know your support and resistance levels, as it is at these levels where you will have a normal movements or confirming actions. Take this system make it yours create a plan following strict money management rules and trade it without emotions.

If you would like to read more on trading look at our new section Best trading books

or return to simple spread betting tips or the home page: Spread betting examples