SpreadTrading the Momentum Indicator

Trading with the momentum Indicator:


 Trend Following

Some like trading with the strength in the Spreadbetting markets and take a long or short position once the Momentum indicator crosses the 50 line. The momentum indicator can be used in both scalping and swing trading. In scalping it would indicate in which direction to spread trade.

Long trade: when the momentum indicator crosses the an absolute value, (often the 50) line to the upside

Short trade: when the momentum line crosses to the downside.

Closing your trade. The momentum indicator is not a good indicator to use to close our trade, because by the time it crosses the 50 line again, most of our profits have been eaten away. You should apply always your money management rules, and look for the when the moment indicator is turning, this would be


Divergence Trading

The momentum indicator is a strong divergence indicator, as prices diminish on their uptrend or down trend velocity the momentum indicator will start turning, thus forming divergence. This is an important concept in technical analysis, the velocity of the price  movement is a leading indicator in a change of trend.


Bullish Divergence can indicate the end of a down trend.


Previous Page:The Momentum Indicator


Momentum Indicator

Momentum Indicator

The Momentum indicator is a very simple and straight forward indicator. It tells you essentially what has been the recent change between the price of your current spread bet and the previous price of n days ago. What this relationship tells you is if your current price is stronger or weaker than the previous price. It is very similar to the ROC (Rate of Change).

It is constructed in a very simple way. It is the current price, lets say of the FTSE , minus the price of the FTSE 20 Bars ago.


  • Current Price – the Price N days ago.


Therefore if the price is below the momentum indicator, we are seeing weakness of the FTSE vs. it’s price N days ago.

If instead the price is above the momentum indicator, we are seeing strength.


An example of the momentum indicator:

Momentum Indicator


page: 

Next Page:Trading with the momentum Indicator


Trading the Commodity Channel Index (CCI)

Trading the Commodity Channel Index (CCI)

Reversal Strategy

Commodity Channel Index (CCI)

 Many use the CCI as an oscillator, as it comprises of 75% of the prices within -100 and +100:

 Spread bet Sell signal: when the channel crosses above the +100 and then falls back below the +100 line.

Spread bet Buy signal: when the channel crosses above the +100 and then falls back below the +100 line.


Trend Following Strategy

The CCI Channels can also indicate when a trend is starting:

Uptrend: When the CCI is above +100 and stays there this indicates a trend is underway. Often this is used with other indicators as a confirming tool. You can use a 3 EMA with the CCI Channels. As you can see from the example above.

Downtrend: When the CCI is above +100 and stays there this indicates a trend is underway. Often this is used with other indicators as a confirming tool. You can use a 3 EMA with the CCI Channels.


Previous Page:The Commodity Channel Index (CCI)


Commodity Channel Index (CCI)

Technical Indicator: Commodity Channel Index (CCI)


The Commodity Cannel Index (CCI) is a very popular indicator used mainly to show overbought and oversold areas. Developed by Donald Lambert mainly for commodities, it is not used on a wide variety of products. The CCI measures the current price relative to an average price, usually 20 prices. These have been created so that between +100 (overbought) and -100 (Oversold) they represent 75% of the price movement.

Often found on most spreadbetting charting packages as there is no volume involved. It is very easy to apply to your spreadbet charts.


Next Page:Trading the Commodity Channel Index (CCI)

Average Directional Index (ADX)2

Trading Signals:

+DI Cross –DI

The +DI compares the two consecutive highs and the –DI compares the two consecutive lows.

Wells Wilder states:

-when the ADX >20 and the + DI is above the –DI. Trade/spread bet Long:

-when the ADX >20 and the -DI is above the +DI. Trade/spread bet short:

example:


Combining the ADX with other Indicators:

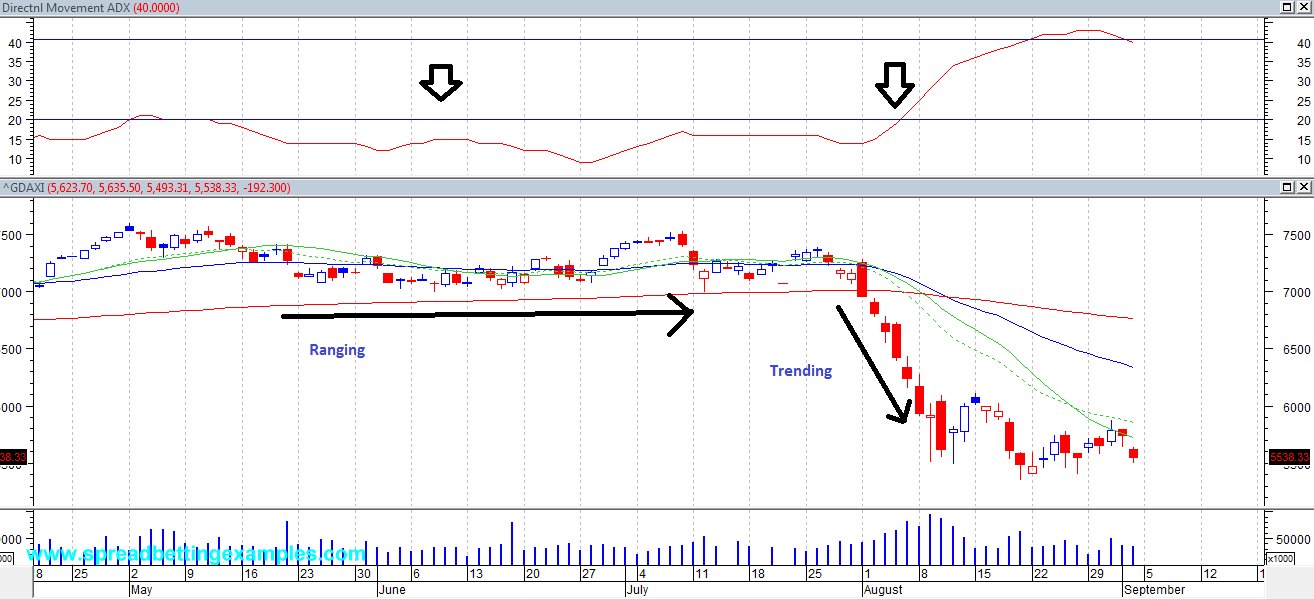
 Ranging Market: Oscillators

Oscillators: When the ADX < 20, this tells us the market is ranging. In a Ranging market the most effective Indicators to use are Oscillators. When markets start trending again these are no more effective. Common oscillators: Bollinger Bands, Moving Average envelopes, RSI, Slow or Fast Stochastic.


Trending Market: Moving averages

 When the ADX >20, the market is trending.  In a Trending market the most effective Indicators to use are Averages. These keep you in a trend for the long run. An effective strategy that an be used to spread bet the EURUSD is the 3 EMA cross and ADX

Previous Page:The Average Directional Index (ADX) trading signal

Average Directional Index (ADX)

Volume Indicator: Average Directional Index (ADX)


The Average Directional Index measures if a stock is trending or not. It also measures the strength of the trend no matter it’s direction, and  it is made up of other two parts, the +DI (Plus Directional Index) and the –DI (Plus Directional Index), which can generate a buy or sell signal.

The ADX, often combined with other indicators, Mainly tells you if what you are trading is ranging or trending. This will help you decide if using a ranging or trending strategy.

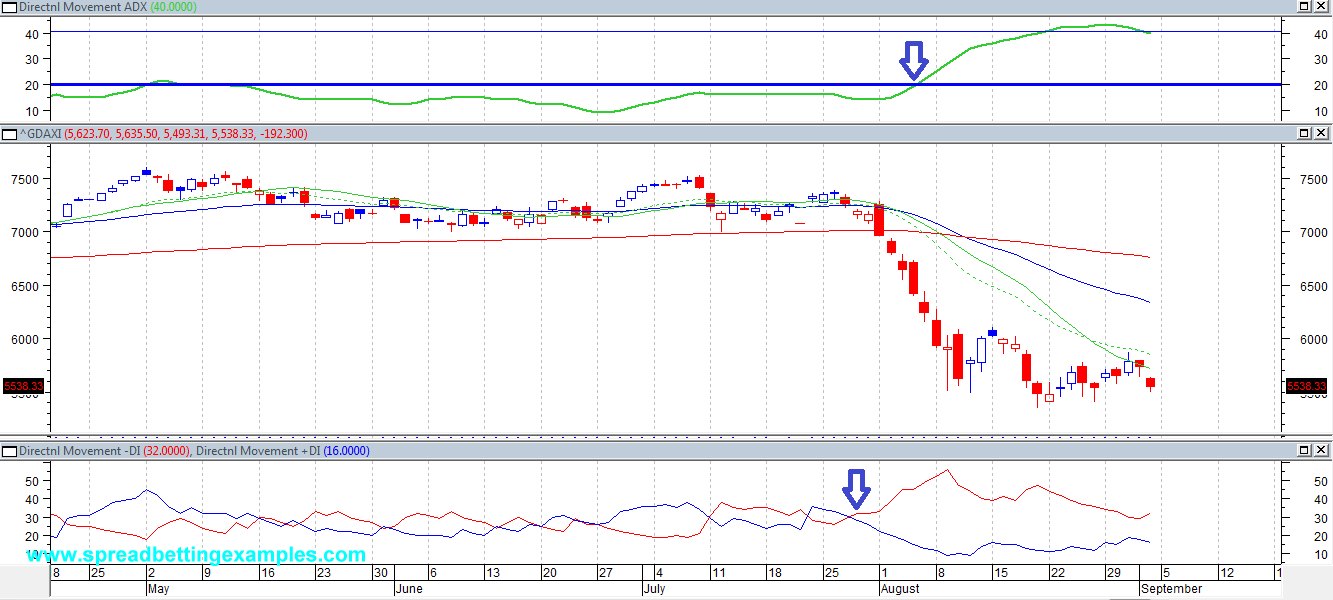
Well Wilder stated that the ADX above 25 shows a trending market and below 20 it is a ranging market. But often the 20 value is the dividing point between trending and not trending. As you can see above in the Dax Rolling bet, it was trading in a 400 point range for four months up until August. At the beginning of August, the DAX broke out of a range and traded lower almost 2000 points. At this point the ADX started moving above the 20 line.


Interpreting the ADX:

 -The ADX above 20:                                      the trend is starting.

-The ADX moving higher from 20 to 40: a trend is under way.

-The ADX above 40:                                        the trend is very strong.

-The ADX moving lower from 40 to 20:   a trend is under way.

-The ADX below 20                                          the markets are ranging.


Lagging Indicator: As you see above the ADX showed the start of the trend a bit. It is a lagging indicator. In fact often The Average Directional Index is complementary to another indicator.


Next Page:The Average Directional Index (ADX) trading signal

On Balance Volume

Volume Indicator: On Balance Volume


On Balance Volume is a tool that quantifies the strength of a price movement or trend. It helps you identify if it is weak or strong.

It is very easy to calculate:

If today’s price closes above yesterday’s price, then we give the volume a positive number. If instead today’s close is below yesterday’s close, we assign the volume a negative number. The close can be one also just one pence. The only thing that is important is the direction of the price, if it is up or down.

The volume is then added up, and an index is created.


For those spread betters that are mathematically minded.


Calculations:

OBV = ( (C-P) / |C-P| * V


Interpreting the On Balance Volume:

As Most Volume indicators, On Balance Volume can be used as a warning tool or confirmation tool.

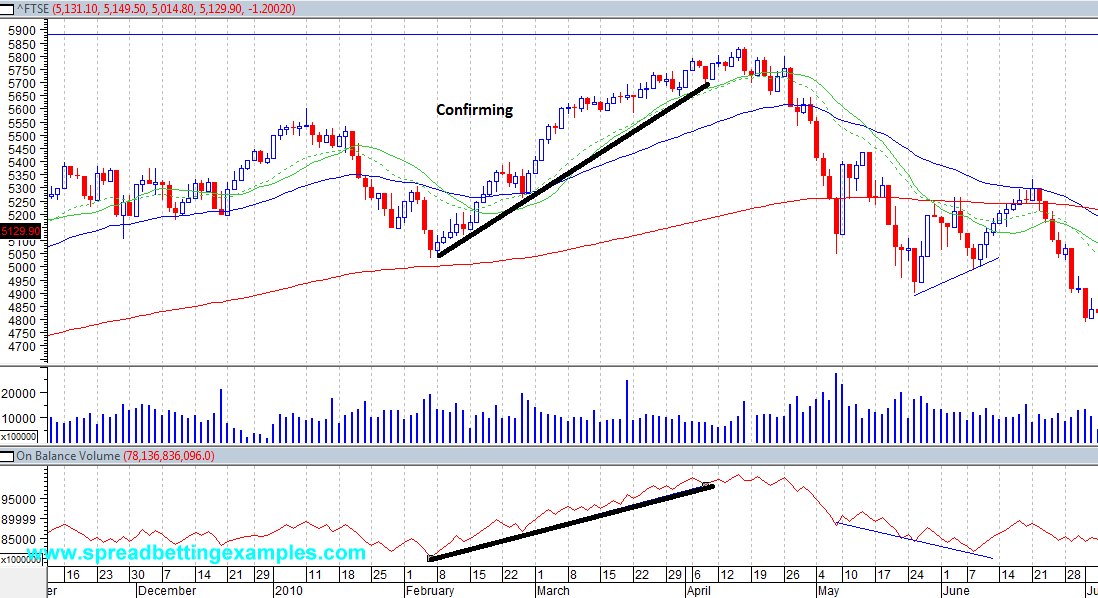
Confirming tool


As you can see in the FTSE Daily Bet, The on balance volume is initially confirming your trade. The on balance volume is making new highs as the prices are making new highs. The On Balance Volume is confirming a strong uptrend in the FTSE 100.

There is a strong commitment from buyers.


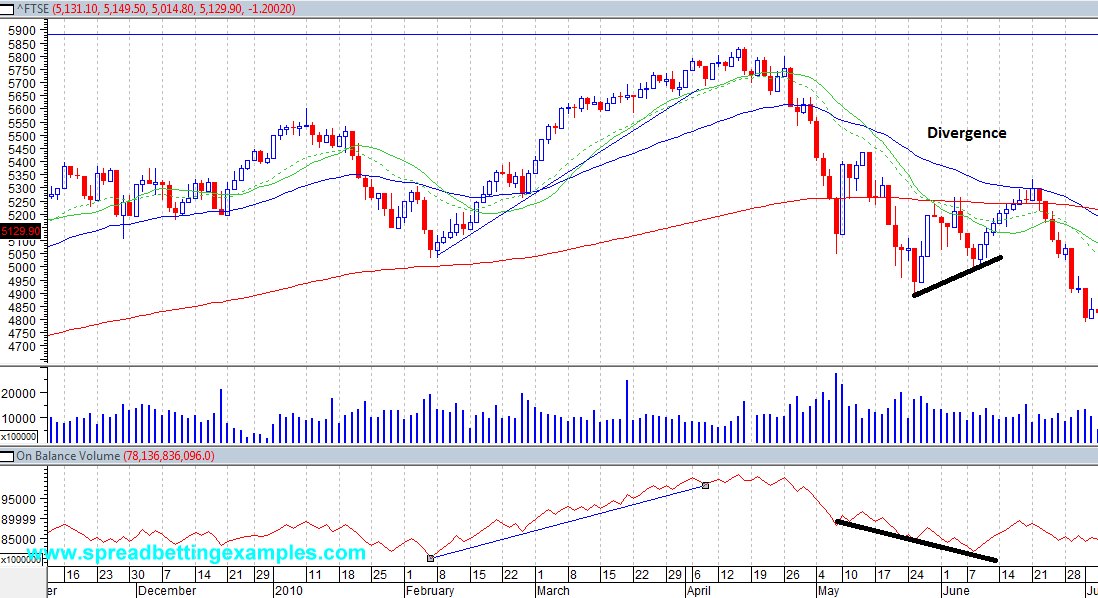
Divergence: A warning tool

Instead in the other part of the FTSE Daily Bet, The on balance volume is showing weakeness as it is making lower lows while the FTSE makes higher lows. After the second peak you can see prices turn around and move lower.

The On Balance Volume has warned those spread better of a possible short, price reversal in the FTSE.


Charts** Not all spread betting platforms provide volume, thus you might not have the On Balance Volume. You will get this on private charting packets.

In conclusion, the On Balance Volume can be used as both a warning tool and a confirming tool.

It is important to add a volume indicator in your price analysis, other volume indicators you can use are the Accumulation Distribution, MFI (Money Flow Index), Chaikin Oscillator and the Price volume trend indicator.