Doji Candlestick

Doji Candlestick

A doji is a very strong candle it show a lot of indecision between the bulls and the bears. Often a Doji is sign of reversal but can also be sign of a continuation. Doji’s are normally found at the bottom of a downtrend. Doji refers to both singular and plural.

The formation of the Doji is when the opening and closing price are the same. When the shadow of the Doji is extremely long this type of Doji is called a long legged doji. Then we have the “Rickshaw Man” which is also a Doji but the difference is that the Rickshaw Man has the opening and closing in the middle of the candle.

The Doji represents indecision, as the bears push prices higher, but then the bulls come in and fight prices lower to then end up at the starting point or opening price.
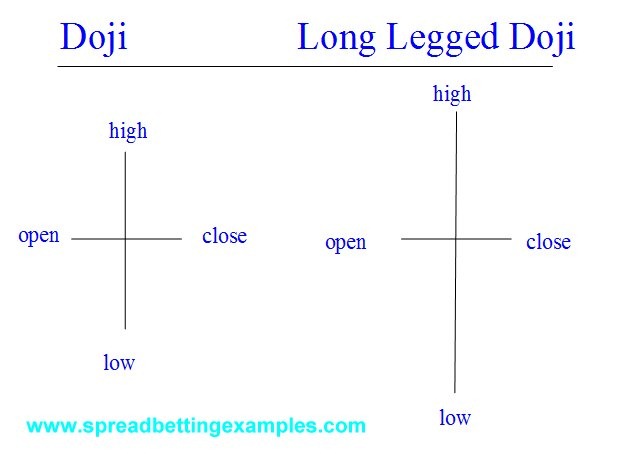
Doji


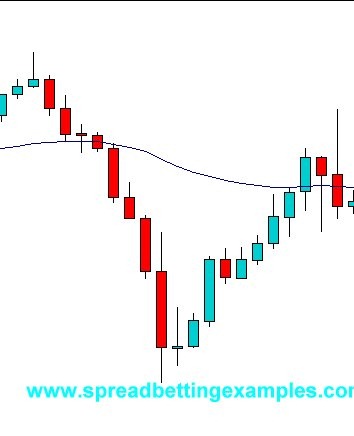
Below is a of a Doji formed in a down trend. As you can see the prices were heading lower until the bears started running out of steam and the bulls took over at the end of the downtrend but were pushed back closing in line with the opening price. The following candle the bulls give it a second chance to gain ground and start pushing prices higher. When a Doji manifests it’self this is a reversal warning signal that there might be a change in trend. This signals either to start scaling down on your position, closing your position or to monitor and be on the alert of a price trend change.

The Doji, is a strong indecision candle but not necessarily a reversal candle, hence it is more a warning candlestick than an actual reversal signal.

Forex Spreadbetting Doji on AUDUSD
Doji_1

While looking at your spreadbetting charts always keep an eye out for the Doji. You can also implement this in a spread betting strategy, but do keep in mind that it is more a warning sign than an actual reversal pattern. Now that we have seen what is a Doji, let’s look at intra day how it is formed.

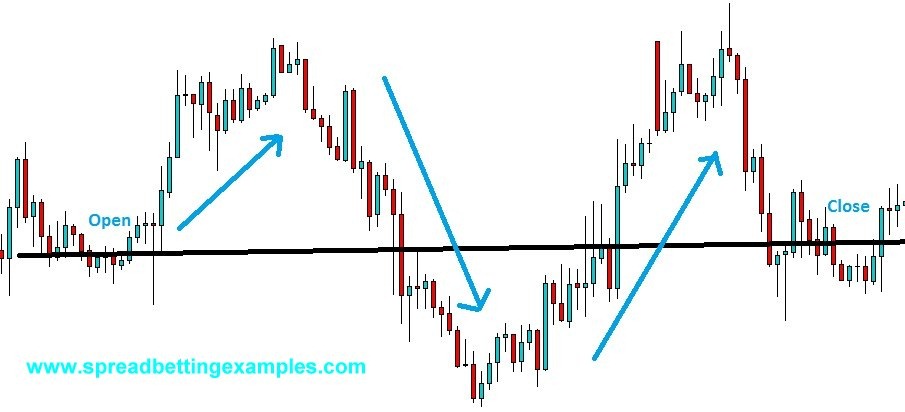
This is a spread betting example of the Doji intra day. There are many ways of forming a Doji.
Doji_formation

Prices opened the day after the overnight drift, heading higher, but soon the bears came in pushing prices lower continuing with the main trend down. Prices make new lows but these lows are defended buy the bulls that push prices higher to then return to the opening price.

There are other powerful Doji Patterns

  • Dragonfly Doji
  • Gravestone Doji


Go back to spread betting candlesticks
FTSE 100 price action scalping

Time frame: 5 Min / 1 min

FTSE 100

Indicators used / Settings: none  / Price Action

********************************

Entry Rules:

This is a very simple strategy that uses no indicators only price action based on candlestick patterns. I use this scalping strategy on the FTSE 100 trading. It requires a lot of patience but is a very effective trading strategy.  Wait for  shooting star or a hammer to form then enter on the open of the next bar.

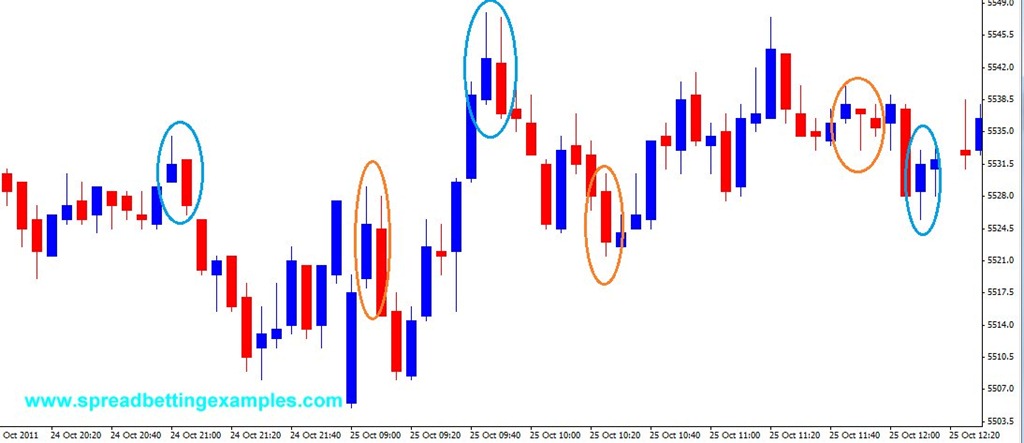
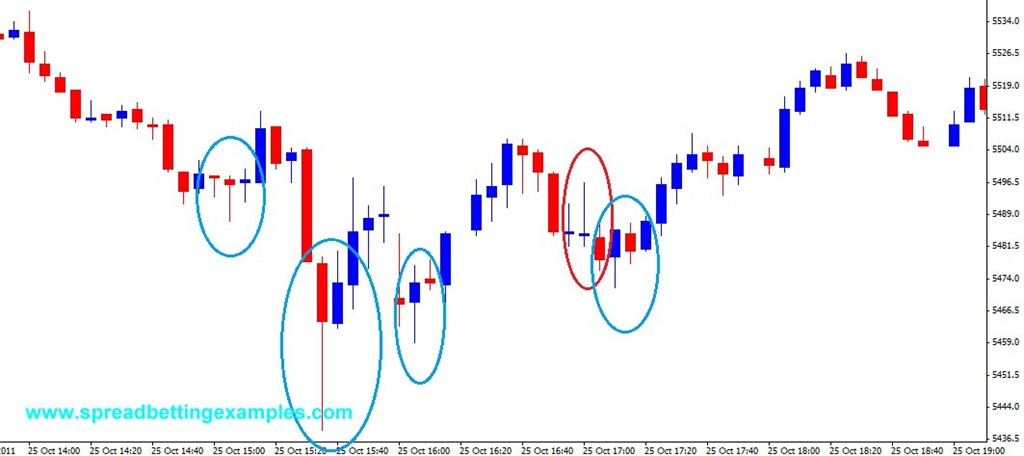
In the Pictures below the blue circles indicate YES TRADE . The red circles are NO TRADE.


Spreadbetting long:

Spread bet long when a hammer forms near the current lows. In the first example you can see this spread betting scalping strategy applied in the first and second blue circles.

Do not trade when the hammer forms while the prices are moving higher. The example in the second picture below, the third red circle is a failed hammer as it occurs within an up trend.

Spread-betting short:

When to short the FTSE100? when a shooting star forms near the current highs. The signal is stronger if the shooting star forms at a resistance level. Furthermore the longer the shadow, the stronger the signal. In the second spreadbetting example below(pic2), the body of the shooting star is relatively small to it’s shadow(first and third blue circle) – this is a strong signal and one to trade. The second circle (red) you can see the shadow is not that long compared to the  body. This is a riskier trade, and don’t suggest to take.

Exit Rules:

This is a Spread betting scalping strategy, so to take 5 max 10 points out of the market.  Your stoploss above / below the low or high of the shadow.

When it works best?

After a rally or a decline and approaching support or resistance

Here is a spread betting example of this FTSE 100 price action scalping strategy

Spread betting example 1

FTSE 100 price action scalping


Spread betting example 2

FTSE 100 price action scalping2

Return to spread betting scalping systems

SpreadTrading the Momentum Indicator

Trading with the momentum Indicator:


 Trend Following

Some like trading with the strength in the Spreadbetting markets and take a long or short position once the Momentum indicator crosses the 50 line. The momentum indicator can be used in both scalping and swing trading. In scalping it would indicate in which direction to spread trade.

Long trade: when the momentum indicator crosses the an absolute value, (often the 50) line to the upside

Short trade: when the momentum line crosses to the downside.

Closing your trade. The momentum indicator is not a good indicator to use to close our trade, because by the time it crosses the 50 line again, most of our profits have been eaten away. You should apply always your money management rules, and look for the when the moment indicator is turning, this would be


Divergence Trading

The momentum indicator is a strong divergence indicator, as prices diminish on their uptrend or down trend velocity the momentum indicator will start turning, thus forming divergence. This is an important concept in technical analysis, the velocity of the price  movement is a leading indicator in a change of trend.


Bullish Divergence can indicate the end of a down trend.


Previous Page:The Momentum Indicator


Moving Average breakout- Spread Betting System

#1) Moving Average BreakOut

This is a very simple, effective and widey used spreadbetting strategy. Many professionals and non-professionals use the the Moving average to identify the trend of the trade, or direction to spreadbet.

Time frame:any. Preference 1hr, 4hr Daily
Tag: Day Trading, Swing Trading, Long term trading
Trading Indicators used: Simple Moving Averages 25 SMA (also widely used 200 MA, 100MA, 55MA)
Charts used: Any. Preference: Dow, GBP/USD, WTI Crude

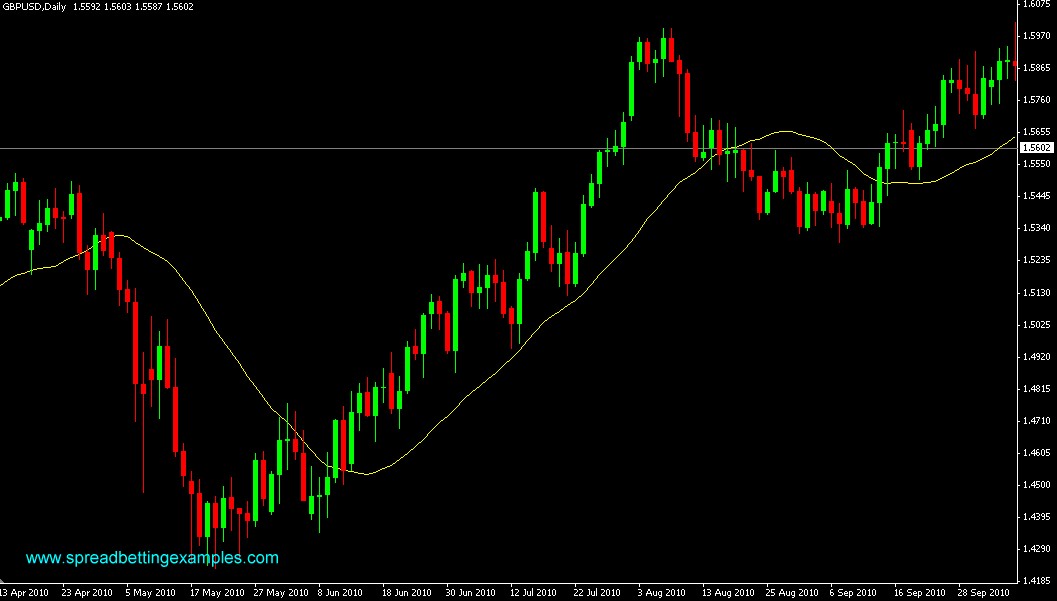
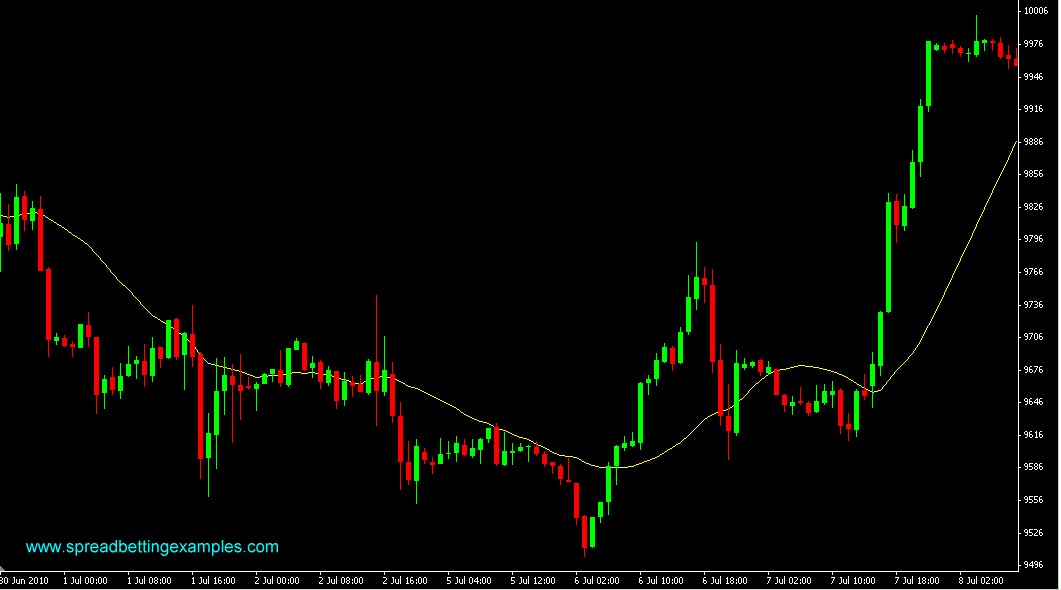
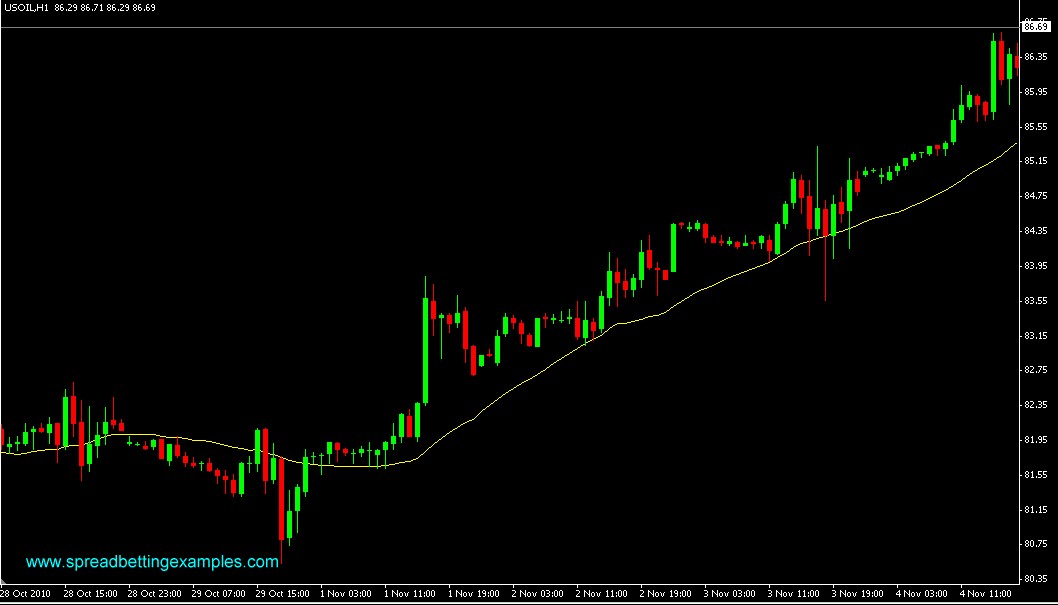
Entry Rules:When the candlestick of the time frame you are trading closes above the Moving Average, You can take a long position in your online spread betting account.

If instead the candlestick of the time frame you are trading closes below the MA, take a short position in your online spreadbetting account.

Exit Rules: You can use your money monangement rules, that is placing a stoploss at a certain % loss of your accounts or once the trade has turned around a certain number of points. This is you discreation.

Others wait for a sell signal to change the position around. This will always keep you in the market. When the market is not trending you could suffer a lot of turn arounds.

Professional traders use Moving Average Breakout strategy to help them determine the trend. If the trading occurs above the Moving average. They prefer spread trading to the long side, and vice-versa. The most common and widely used Moving averages are the 200 MA, 100AM, 55 MA and 25 MA.

Advantages: You Spread trade with the trend. Going against the trend could put you in difficulty.

Disadvantages: The moving average is a lagging indicator, and it can put you late into a trend.

Spread betting Examples

25MAis on  GBP/USD Daily &  1hr on DAX and  WTI Crude