Bullish Engulfing Pattern

Bullish Engulfing Pattern

The Bullish Engulfing Candlestick Pattern is a bearish reversal pattern, which usually occurs at the Bottom of a down trend and it consists of a a small bearish candlestick with a small tail followed by a reversal bullish candlestick that overshadows or “engulfs” the small bearish one. The opposite of the Bullish Engulfing pattern is the Bearish Engulfing pattern.

Bullish engulfing pattern

Smaller Bearish Candle (Day 1)

Larger Bullish Candle (Day 2)

So how does this pattern form?

Prices are in a downtrend nearing a support level, and a bearish candle forms on Day 1, which is near or on support level. On Day 2 prices gap downwards, opening lower than Day 1 close.

On Day2 the market gapped downward, but the bears failed to push prices lower, finding lost of buyers in their paths. Normally this occurs when we approach near a support level, where there are many bulls awaiting. The strength of the bulls and weakness of the short sellers pushes Day 2 to close higher than Day 1 open. In this scenario the body of Day 2 has engulfed Day 1, forming the Bullish Engulfing Pattern.

As stated above, this occurs near support levels in a downtrend, on a pivot point in a downtrend, or just given a strong change in sentiment in the markets. In fact prices go from a bearish gap down on the open, to the big blue bullish real body candle that closes higher than the previous day’s open. Bulls have successfully overpowered the bears on the day(2) and this positive sentiment is likely to continue for the next few coming days.


Bearish Engulfing Pattern

Bearish Engulfing Pattern

The Bearish Engulfing Candlestick Pattern is a bearish reversal pattern, which usually occurs at the top of an up trend and it consists of a a small bullish candlestick with a small tail followed by a reversal candlestick that overshadows or "engulfs" the small bullish one. The opposite of the Bearish Engulfing pattern is the Bullish Engulfing pattern.

Bearish engulfing pattern

Smaller Bullish Candle (Day 1)

Larger Bearish Candle (Day 2)

So how does this pattern form?

Generally, we find ourselves in an uptrend and a bullish candle forming on Day 1. On Day 2 prices gap upwards but opening higher than Day 1 open.

On Day two the market gapped up, but the bulls fail to push prices higher. Normally this occurs when we approach near a resistance level, where there are many bears awaiting. The strength of the bears and weakness of the bulls pushes Day 2 to close lower than Day 1. In this scenario the body of Day 2 has engulfed Day 1, forming the Bearish Engulfing Pattern.

As stated above, this occurs near resistance point or pivot point, or just a strong change in sentiment in the markets. In fact prices go from a bullish gap up at the open, to the big red bearish real body candle that closes lower than the previous day’s close. Bears have successfully overpowered the bulls on the day and the sentiment is likely to continue for the few periods.


Bearish engulfing pattern_African Barr Gold

A spread betting example of a Bearish Engulfing Pattern and how to apply it in a strategy

Here is a chart below of African Barr Gold, that illustrates a Bearish Engulfing Pattern at the top of an uptrend. The question is when to sell.

1) Sell near the close of Day2. As it comes close to the end of the day, and the prices are closing lower than the previous day’s close. This is a negative sign, the more aggressive traders will sell near the close so they try to anticipate a downward move the following day(3).  Ideally this pattern is accompanied by volume confirmation.

2) Sell on the open of Day 3.  These are traders that wait for the complete pattern to form. End of day traders. Once they recognize the pattern they sell on the Day 3 open.

3) Wait for further confirmation to sell. Here are the more cautious traders that look for further confirmation. or look for a good entry point to sell, maybe a little bounce back up to a resistance point, then they sell. As it happened in day 3 and day 6.

The Bearish Engulfing Pattern is one of the strongest candlestick reversal patterns. The opposite pattern is the Bullish Engulfing Pattern.

Back To

Morning Star

Morning Star Japanese Candlestick Pattern

The Morning Star Pattern usually occurs at the bottom of the downtrend and is a bullish reversal pattern. The pattern has three components:

Day1)  Large Bearish Day: A long black candlestick.
Day2) A small Bullish or Bearish candlestick that gaps below the previous day’s close. This candlestick could also be a doji, in which case the pattern would be a morning doji star.
Day3) A long Bullish candlestick.

of the morning star.

Morning Star

The Morning Star pattern appears at the bottom of a downtrend with a first large bearish reversal candlestick pattern. The first day, the bears are definitely in control, often making new lows.

Day 2 begins with a bearish gap down. It is clear from that the bears are in control as this candle stick gaps lower. However, as the day proceeds, the bears are unable to push prices lower. The candlestick on Day 2 is often a small candlestick and can be bullish, bearish, or a Doji candlestick pattern (neutral/Indecision).

A bullish candlestick on Day 2 is a stronger sign of  turn in trend, indicating a possible reversal. But Day 3 is the highlight of the Morning Star Pattern, as it begins with a gap up. This is a strong bullish sign showing the bulls are in control, pushing prices higher, often reversing Day 1’s losses.

Morning Star Forex Spread Betting Example

The chart below of the Forex Spread betting pair EUR/GBP shows a spread betting example of a Morning Star bullish reversal pattern that occurred at the end of a downtrend:

EURGBP Morning Star

Day 1 of the Morning Star pattern in the EURGBP chart above was a strong red bearish red candle. Day 2 showed sign of reversal as the Day ended with a small positive sign after opening with a Gap Down. Day 2 Bears were unable to continue the downtrend of the previous day. Day 3 the bears tried again to push lower but failed and the bulls took strong control, Pushing aggressively upwards squeezing the bears out of the market and closing way above the close of Day 1. Both the downward trendline break and the classic Morning Star pattern gave traders a signal to go long and buy EURUSD Forex Spread betting pair.

The Morning Star pattern is a very strong three candlestick bullish reversal pattern. The opposite of the Morning Star Pattern is the Evening Star pattern, a bearish pattern (see: Evening Star).

Back to

Gravestone Doji

Gravestone Doji

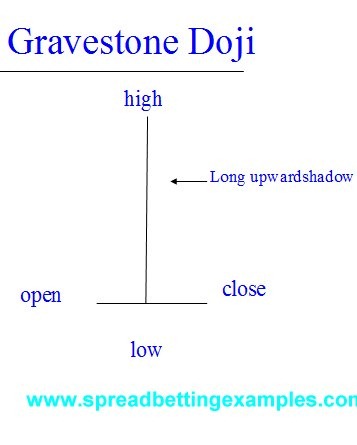
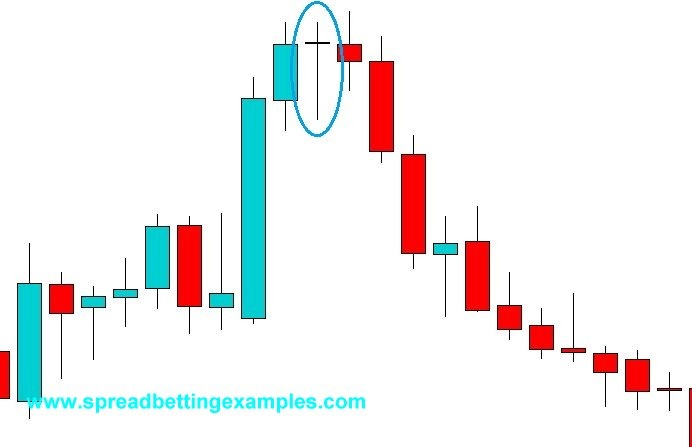
On the other hand we have the Gravestone Doji, which is a strong bearish candlestick pattern that occurs at the top of bull trend, often near the highs.

GravestoneDoji

The Gravestone Doji, as a typical Doji has it’s opening and closing at close to the same price. Rarely these two prices are the same price. However the most important feature of the Gravestone doji is that it has a long upward shadow.

This long shadow implies that the market tries to make new highs but find strong bearish resistance that push it all the way down to where prices started off, or opened. Therefore there is an overpowering of the bears over the bulls.

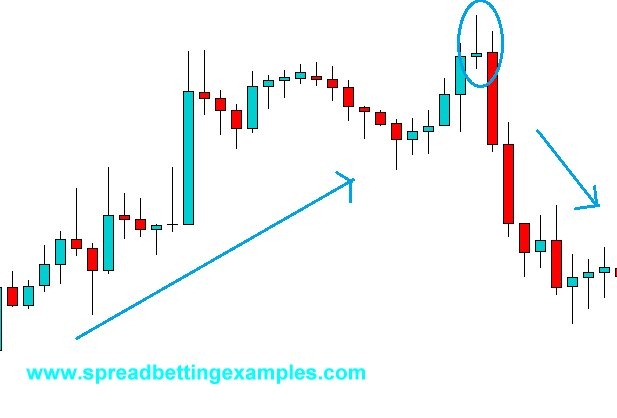
Below is a of the Gravestone Doji in a Forex EURUSD trade.


Gravestone Doji

As you can see prices were heading higher in an uptrend, slowed down, then tried to push higher until the bulls found bears defending the higher prices. These bears pushed the prices back to the candlestick’s opening price (gravestone Doji). The candlestick that followed was a strong bearish candlestick.

The Gravestone Doji is extremely helpful to indicate where there is strong resistance. If this resistance is broken we can find a substantial move higher.

In a spread betting system a trader would wait for the following bearish candlestick after the Gravestone Doji, as confirmation of the trend reversal. It is important to use a confirming candlestick. Some more aggressive traders would enter as the Gravestone Doji is formed; maybe with smaller stakes taking on smaller risks.


Back to

Back to candlestick patterns

Doji Candlestick

Doji Candlestick

A doji is a very strong candle it show a lot of indecision between the bulls and the bears. Often a Doji is sign of reversal but can also be sign of a continuation. Doji’s are normally found at the bottom of a downtrend. Doji refers to both singular and plural.

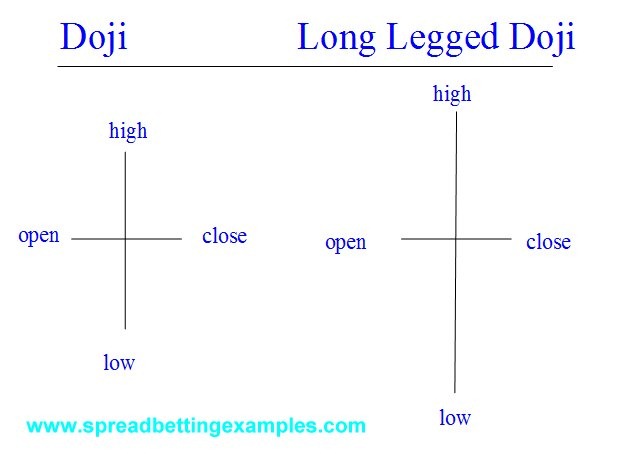
The formation of the Doji is when the opening and closing price are the same. When the shadow of the Doji is extremely long this type of Doji is called a long legged doji. Then we have the “Rickshaw Man” which is also a Doji but the difference is that the Rickshaw Man has the opening and closing in the middle of the candle.

The Doji represents indecision, as the bears push prices higher, but then the bulls come in and fight prices lower to then end up at the starting point or opening price.

Doji


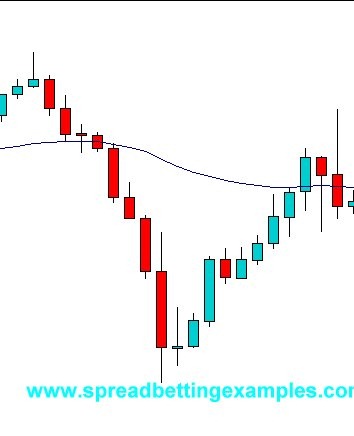
Below is a of a Doji formed in a down trend. As you can see the prices were heading lower until the bears started running out of steam and the bulls took over at the end of the downtrend but were pushed back closing in line with the opening price. The following candle the bulls give it a second chance to gain ground and start pushing prices higher. When a Doji manifests it’self this is a reversal warning signal that there might be a change in trend. This signals either to start scaling down on your position, closing your position or to monitor and be on the alert of a price trend change.

The Doji, is a strong indecision candle but not necessarily a reversal candle, hence it is more a warning candlestick than an actual reversal signal.

Forex Spreadbetting Doji on AUDUSD

Doji_1

While looking at your spreadbetting charts always keep an eye out for the Doji. You can also implement this in a spread betting strategy, but do keep in mind that it is more a warning sign than an actual reversal pattern. Now that we have seen what is a Doji, let’s look at intra day how it is formed.

This is a spread betting example of the Doji intra day. There are many ways of forming a Doji.

Doji_formation

Prices opened the day after the overnight drift, heading higher, but soon the bears came in pushing prices lower continuing with the main trend down. Prices make new lows but these lows are defended buy the bulls that push prices higher to then return to the opening price.

There are other powerful Doji Patterns

  • Dragonfly Doji
  • Gravestone Doji


Go back to spread betting candlesticks

Hammer

Hammer

Bullish Reversal Pattern

What is a hammer?

The is a bullish reversal candlestick. Most bullish reversal patterns this pattern will

-occur within a downtrend or at the bottom of a trend
-Often it is followed by a confirmation candle.

Be aware with bullish reversal candlesticks this is a warning sign of  a possible change in trend, but it is not a signal. Traders normally look for confirmation of a change of trend on the next candle.

Formation:

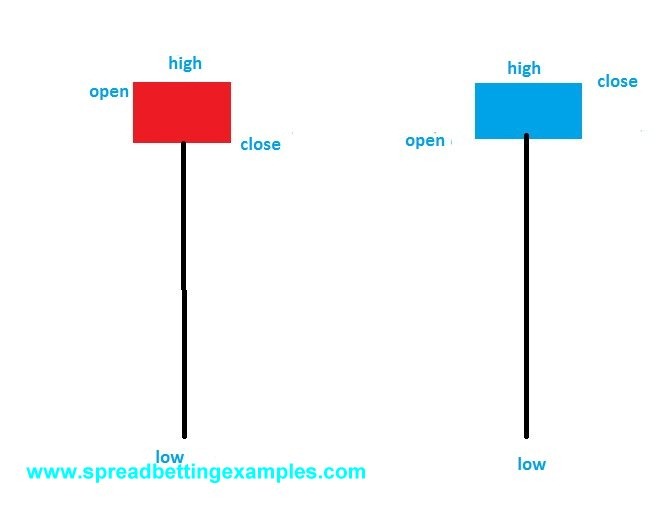
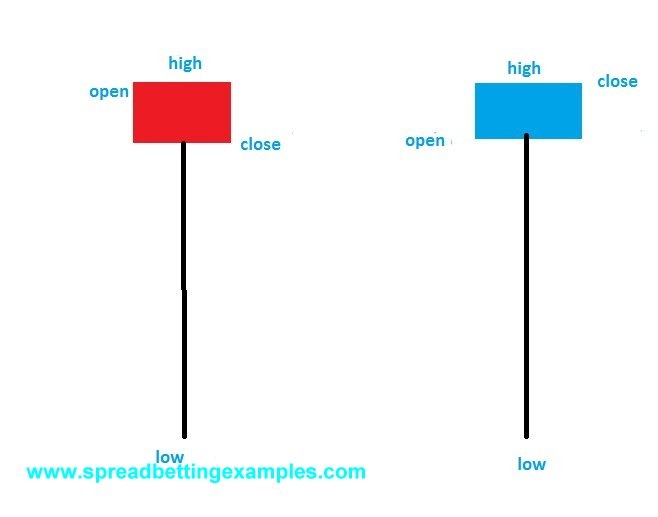
The formation of the hammer , very similar to a hanging man  , this is created when the opening, closing and low prices of the candlestick are in the same area. The hammer will have a long downward shadow. Normally the shadow is 2 to 3 times the size of the body.  The main difference between the hammer and the hanging man is that the hammer occurs at the bottom of the trend and it is a bullish reversal pattern, instead the hanging man occurs at the top of a trend and it is a bearish reversal pattern.

The hammer as the hanging man is created when we get to an oversold area or support point where the bulls are strong. The bulls will stop the prices from moving any lower and push them back up to the opening price. On the next candle the bulls will push the prices higher. This shows a change in strength and the bulls taking control.

The hammer is a strong reversal pattern.

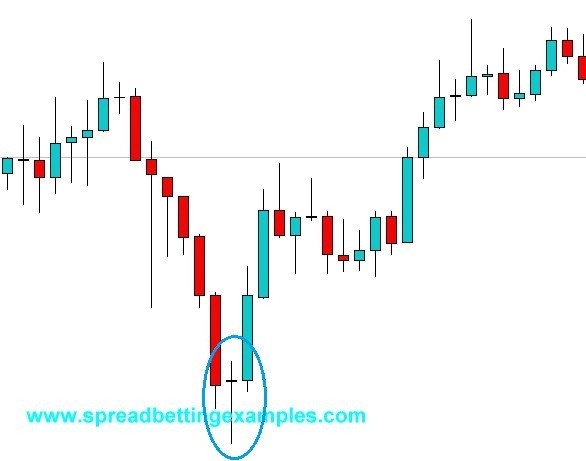
A hammer is often applied to many price action spread betting strategies. Below is a spread betting example of the hammer.

Hammer


How to trade the hammer?

Below is a Forex Spread betting example of the EURUSD.  As you can see prices started falling until the bears met with the bulls that were strong enough to turn around the prices. In a trading strategy the hammer is your warning signal of a change of trend. The candle stick that follows is a strong bullish candle as it closes near it’s highs. On the close of the confirmation candle will conservative traders enter a new trade.


Hammer_EURUSD_2


Back to Spread betting candlestick patterns

Hanging Man

Hanging Man

Bearish Reversal Pattern

The hanging man is a bearish reversal candlestick. Most bearish reversal patterns this pattern will

-occur within an uptrend or at the top of a trend
-Often it is followed by a confirmation candle.

Remember with bullish reversal candlesticks, these are warning sign of  a possible change in trend, but it is not a signal. Traders normally wait for confirmation of a change of trend on the next candle.

Formation:

The formation of the hanging man , very similar to a hammer, this is created when the opening, closing and low prices on a candlestick are in the same area. The hanging man will have a long downward shadow. Normally the shadow is 2 to 3 times the size of the body.  The main difference between the hammer and the hanging man is that the hammer occurs at the bottom of the trend and it is a bullish reversal pattern, instead the hanging man occurs at the top of a trend and it is a bearish reversal pattern.

The hanging man is created because the moment we get to an overbought level or a resistance point where the bears are strong, they stop the prices from moving any higher. On the next candle the bears actually push the prices lower. This shows a change in strength and the bears pushing prices back down.


The hanging man is not as strong reversal pattern as the shooting star.

A hanging man is often applied to many price action spread betting strategies. Below is a spread betting example of the hanging man.


Hanging Man


How to trade the hanging man?

Below is a Forex Spreadbetting example of the hammer in GBPUSD. As you can see the bulls were in control, pushing prices higher until they met resistance. In the hammer the bears pushed the prices lower but the bulls were able to give a last push higher, forming the hanging man. On the next candle the bears took control and pushed prices lower.


Hanging Man_GBPUSD_


Back to Spread betting candlestick patterns

Shooting Star

Shooting Star

Bearish Reversal Pattern

What is a Shooting Star?

The shooting star is a bearish reversal candlestick. Most bearish reversal patterns this pattern will

-occur within an uptrend or at the top of a trend
-Often it is followed by a confirmation candle.

Be aware with bullish reversal candlesticks this is a warning sign of  a possible change in trend, but it is not a signal. Traders normally look for confirmation of a change of trend on the next candle.

Formation:

A shooting star is created when the opening, closing and low prices on a candlestick are in the same area. The shooting star will have a long upward shadow. Normally the shadow is 2 to 3 times the size of the body.  The whole theory behind this is that prices have been moving higher until they reach a high point or a resistance. They try move higher but the sellers come in and push the prices all the way back down to the opening price. This shows the strength in the sellers.

A strong pattern shooting star is formed when the closing price is in line with the opening price or is lower than the opening price.

Shooting stars are often applied in many price action spread betting strategies. Below is a spread betting example of the shooting star.

Shooting star


Here is an example of the shooting star applied in a scalping spread betting strategy on the FTSE.


How to trade the shooting star?

Below is a of a shooting star in GSK.L

GSK Shooting

As you can see in this strategy the prices were moving in an uptrend, until prices reached a new high. At this high, a lot of selling pressure comes into the market that pushes the prices way below the opening price of the candle. The next day is dominated by sellers again that the prices close near their lows on a very strong bearish candle. The Bulls try another attempt but are unable to push higher the following day. The shooting star is the first candle that marks a change in trend.

Back to