Gravestone Doji

Gravestone Doji

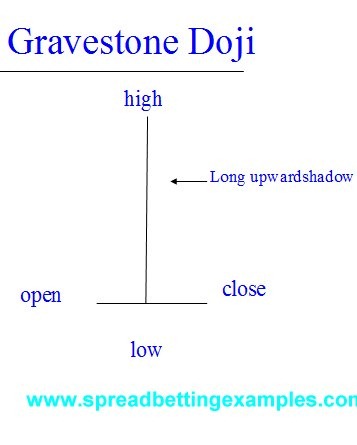
On the other hand we have the Gravestone Doji, which is a strong bearish candlestick pattern that occurs at the top of bull trend, often near the highs.
GravestoneDoji

The Gravestone Doji, as a typical Doji has it’s opening and closing at close to the same price. Rarely these two prices are the same price. However the most important feature of the Gravestone doji is that it has a long upward shadow.

This long shadow implies that the market tries to make new highs but find strong bearish resistance that push it all the way down to where prices started off, or opened. Therefore there is an overpowering of the bears over the bulls.

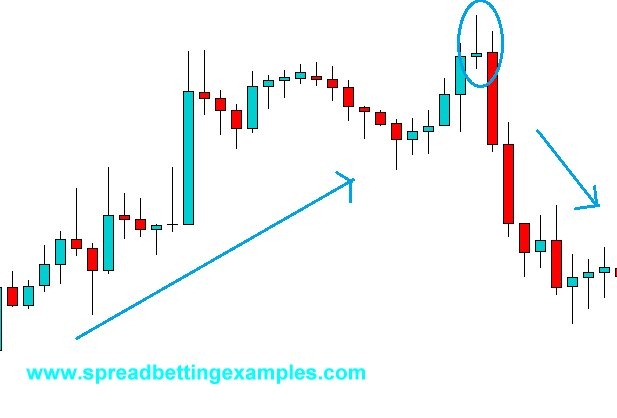
Below is a of the Gravestone Doji in a Forex EURUSD trade.
 

Gravestone Doji

As you can see prices were heading higher in an uptrend, slowed down, then tried to push higher until the bulls found bears defending the higher prices. These bears pushed the prices back to the candlestick’s opening price (gravestone Doji). The candlestick that followed was a strong bearish candlestick.

The Gravestone Doji is extremely helpful to indicate where there is strong resistance. If this resistance is broken we can find a substantial move higher.

In a spread betting system a trader would wait for the following bearish candlestick after the Gravestone Doji, as confirmation of the trend reversal. It is important to use a confirming candlestick. Some more aggressive traders would enter as the Gravestone Doji is formed; maybe with smaller stakes taking on smaller risks.


Back to

Back to candlestick patterns

Bollinger Bands breakout strategy (the squeeze)

Now we will show you completely the opposite of what we showed you earlier. This is a Bollinger band breakout strategy. This spread betting strategy works especially when prices have been trading in a range and there has been no decision on direction. Then suddenly they move either lower or higher and break out of the range.

The Squeeze: This strategy is also known as the squeeze, as prices will start trading in a range before the breakout, the Bollinger upper band and lower band will squeeze

Look at the spread betting example of Xstrata (XTA.L) below:

Xstrata (xta) -Bollingerbands breakout strategy


Bollinger Band Break out – LONG

Traders trade the prices long when prices have gone into a rage or consolidation, the bands squeeze and prices break to the upside closing above the bands.

Bollinger Band Break out – SHORT

on the other hand a short occurs when prices break out of the squeeze to the downside closing below the bands.  In this case, as we can see the spread betting example above, Xstrata  broke it’s range to the downside, the prices closed below the band and the prices continued lower.

How to control your risk. This depends on your risk tolerance. Some traders, with a higher risk tolerance put their stop above the range, others with a lower risk tolerance would put their stop loss just above the middle of the band


Measuring the strength of a trend

This same method can be used to measure the strength of a trend. Once the break out occurs and prices remain in the top half or bottom half of the Bollinger Band. Not crossing the middle line, this indicates that the strength of the trend is strong and it likely to continue.

Xstrata (xta) -Bollingerbands - trend stregnth


Previous: Bollinger Bands Mean reversion

Bollinger Bands

Bollinger bands are a measurement of volatility. This is a very popular indicator created by John Bollinger. They can be used in many different ways. These are created by measuring the 2 standard deviation from a 20 day moving average of the price.They have three part to this technical indicator:


The moving average: This is the 20 day simple moving average of the prices

The lower band: The lower band is simple moving average minus the 2 standard deviation. therefore located below the middle band.

The upper band:The upper band is simple moving average plus the 2 standard deviation. therefore located above the middle band.


Here is an example of the Bollinger band. We have taken our spread betting graph of the WTI Crude oil:

Crude Oil -Bollingerbands in spreabetting


Now lets look at how the Bollinger Bands are used in the various spread betting strategies:

Next: Bollinger Bands mean reversion strategy

Exponential Moving Averages

Exponential Moving Averages

The exponential moving average also known as the exponential smoothing. This indicator is the one preferred by technical analysts of the various different moving averages, as it is a balance between the simple moving average, that lags and the weighted moving average that is over sensitive.

The simple moving average gives more weight to the current prices. Therefore it’s advantage is that it is quicker and follows the prices better. The disadvantage is that it ism more prone to whipsaw than the simple moving average.

From the chart you can see the difference between the simple moving average and the exponential moving average.

FTSE 100 - Exponetial Moving Average

As you can see the Exponential moving average follows the FTSE 100 closer. The SMA (Simple Moving Average) is less sensitive to price movement.


Now I will show you a spread betting strategy of two moving average cross and how the two different  averages react.


FTSE INDEX - 2 Exponential Moving Average Crossover_b


FTSE INDEX - 2 Simple Moving Average Crossover_b

You can see above how the exponential moving average crosses earlier than the simple moving average. giving you an earlier short spread betting signal. But it also gives you an earlier signal to close out your trade.

when deciding which spread betting strategy to use. You must decide which moving average will fit your style of trading. You could also mix the two. using an EMA to enter and a SMA to exit.


Next:Weighted Moving average

Moving Averages, Simple and Exponential

Moving Averages, Simple and Exponential

This Indicator is often used in various spreadbet strategies.

The moving average is a simple average price of the last n prices.  This is a lagging indicator, that is used to smooth data and filter out noise.  The moving average is also a base indicator for many other indicators you will see in the spread betting strategies you will find in http://www.spreadbettingexamples.com/.

There are two types of averages, the simple moving average and the exponential moving average.


As you can see below, the difference between exponential moving average and simple moving average:

The Simple (SMA) is the green line, it lags a little. Instead the EMA follows the prices more closely (blue line).

Moving Averages - Spreadbetting FTSE

The Simple Moving Average:

The simple moving average as described above is the simple average of the prices.

Calculations:

Prices: 1.4300 1.42931.42591.42771.42681.4238

1.4251

5 Day Average: (1.4300  +

1.4293 +1.4259 +1.4277 +

1.4268 )/5 = 1.42794

1.42794 is the average price of the last 5 days. if the current price is above 1.42794,  this means the current price is stronger than the price of the last five days.

Many spreadbetters use the Moving average as a trend following tool. Those that trade in the direction of the trend, trade with the strength. Therefore if the FTSE is trading below it’s 200 Day moving average this indicates weakness. Trend following spreadtraders will short the FTSE Rolling Bet.


Next Page: Exponential Moving average.