Alligator Scalping system

Alligator Scalping Strategy

Time frame: 5 Min

Tag: GBPUSD

Indicators used / Settings:

Exponential moving averages

Yellow: Pink:
Ema 3
Ema 5
Ema 7
Ema 9
Ema 11
Ema 13
Ema 21
Ema 24
Ema 27
Ema 30
Ema 33
Ema 36

Ema 55 Color Red

Possible other spread betting charts:

********************************

Spread Betting Example

Entry Rules:

When the yellow bands cross the pink bands this is your entry signal. I will present this strategy in two ways, for those that are risk averse and for those that don’t mind risk.

Spread-betting long:

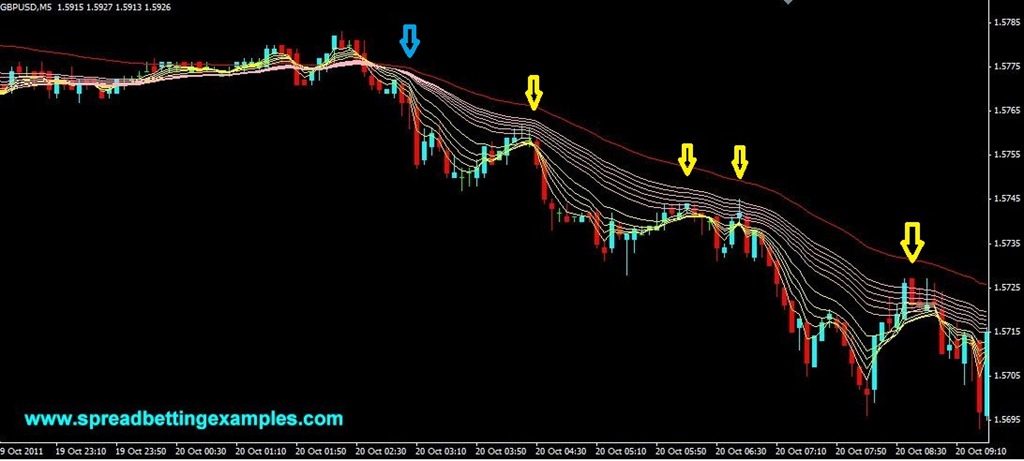
Trade Long when the yellow bands cross the pink bands to the upside.  The cross over of the bands should occur above the 55 EMA line.
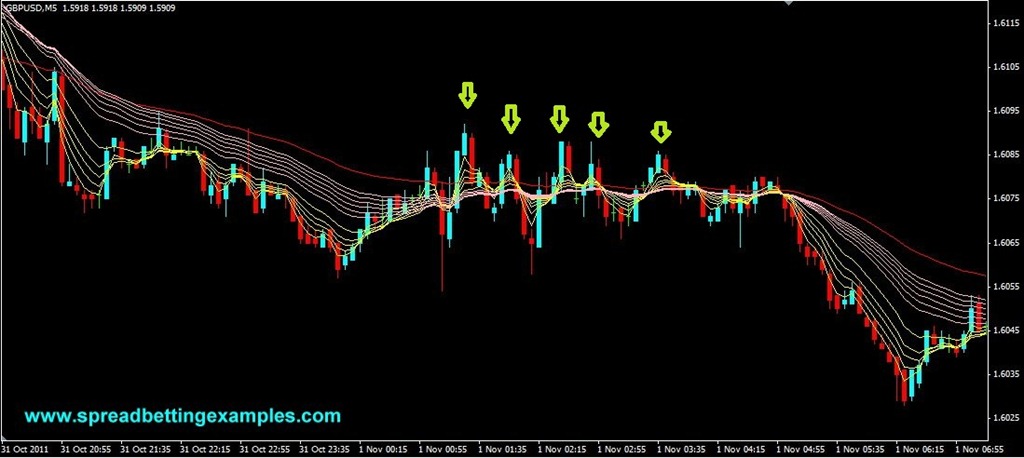
Risk averse: The above strategy could lead to some false entries as you can see in the second diagram. For those spread betters that are risk averse,  trade the rebound: After prices have broken to the upside, wait for the , that is prices to come back down into the pink bands  then trade long.

Spread-betting short:

Spread betting short is the opposite. Trade short when the yellow bands cross the pink bands to the downside.  The cross over of the bands should occur below the 55 EMA line.  for those risk averse

Exit Rules:

This is a scalping strategy, therefore keep to your money management rules.
on GBPUSD: use a target of 5-10 points and a stop loss of about 15 points. These targets could change according to what you are trading, You should determine your money management rules.

********************************

*best time for this strategy is on the European open or after a move has started.

*******************************

Here is a spread betting example of the Alligator Scalping system strategy on GBP USD

Arrows indicate entries. the risk averse spread betters would only scalp the yellow arrows.
Alligator Scalping


Here is an example of the disadvantage of this system. you might get false break outs.  A risk averse trader will avoid these false breakouts, as he trades only the retracements (indicated above by the yellow arrows).
 

Alligator Scalping_2


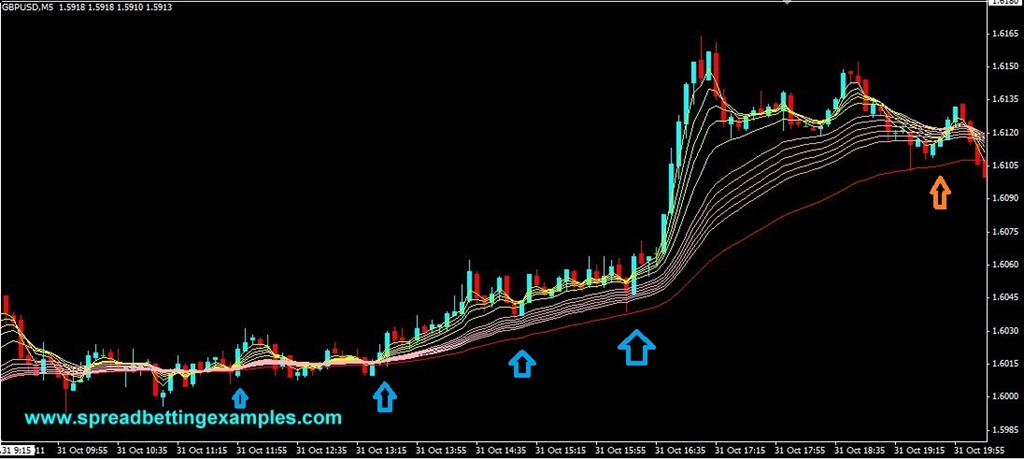
Below the spread betting example shows various entries. and the red arrow is the trader being stopped out.
Alligator Scalping_3


Back to

Exponential Moving Averages

Exponential Moving Averages

The exponential moving average also known as the exponential smoothing. This indicator is the one preferred by technical analysts of the various different moving averages, as it is a balance between the simple moving average, that lags and the weighted moving average that is over sensitive.

The simple moving average gives more weight to the current prices. Therefore it’s advantage is that it is quicker and follows the prices better. The disadvantage is that it ism more prone to whipsaw than the simple moving average.

From the chart you can see the difference between the simple moving average and the exponential moving average.

FTSE 100 - Exponetial Moving Average

As you can see the Exponential moving average follows the FTSE 100 closer. The SMA (Simple Moving Average) is less sensitive to price movement.


Now I will show you a spread betting strategy of two moving average cross and how the two different  averages react.


FTSE INDEX - 2 Exponential Moving Average Crossover_b


FTSE INDEX - 2 Simple Moving Average Crossover_b

You can see above how the exponential moving average crosses earlier than the simple moving average. giving you an earlier short spread betting signal. But it also gives you an earlier signal to close out your trade.

when deciding which spread betting strategy to use. You must decide which moving average will fit your style of trading. You could also mix the two. using an EMA to enter and a SMA to exit.


Next:Weighted Moving average

Moving Averages, Simple and Exponential

Moving Averages, Simple and Exponential

This Indicator is often used in various spreadbet strategies.

The moving average is a simple average price of the last n prices.  This is a lagging indicator, that is used to smooth data and filter out noise.  The moving average is also a base indicator for many other indicators you will see in the spread betting strategies you will find in http://www.spreadbettingexamples.com/.

There are two types of averages, the simple moving average and the exponential moving average.


As you can see below, the difference between exponential moving average and simple moving average:

The Simple (SMA) is the green line, it lags a little. Instead the EMA follows the prices more closely (blue line).

Moving Averages - Spreadbetting FTSE

The Simple Moving Average:

The simple moving average as described above is the simple average of the prices.

Calculations:

Prices: 1.4300 1.42931.42591.42771.42681.4238

1.4251

5 Day Average: (1.4300  +

1.4293 +1.4259 +1.4277 +

1.4268 )/5 = 1.42794

1.42794 is the average price of the last 5 days. if the current price is above 1.42794,  this means the current price is stronger than the price of the last five days.

Many spreadbetters use the Moving average as a trend following tool. Those that trade in the direction of the trend, trade with the strength. Therefore if the FTSE is trading below it’s 200 Day moving average this indicates weakness. Trend following spreadtraders will short the FTSE Rolling Bet.


Next Page: Exponential Moving average.