Volume Indicator: Accumulation Distribution

Volume Indicator: Accumulation Distribution


Accumulation Distribution is a volume based indictor that is used as a price confirming tool or a warning tool that anticipates price change.

The Accumulation Distribution is a variation of the On Balance Volume. The main difference in the Accumulation Distribution is that the volume is weighted relative to the closing price.


You will not find this indicator on many spread betting platforms as they do not report volume, but if you subscribe to any charting software they will contain volume information.


Accumulation Day: the volume is added when the price closes higher than the previous day’s close. The amount of volume added to the indicator is multiplied by the relationship of the closing price relative to the daily range.

Distribution Day: the volume is subtracted when the price closes lower than the previous day’s close. The amount of volume subtracted from the indicator is multiplied by the relationship of the closing price relative to the daily range.


In Summary, when the day is in accumulation the volume is added to the previous day’s Accumulation Distribution line, and vice versa when the day is a distribution day;


Accumulation Distribution: Price confirming tool

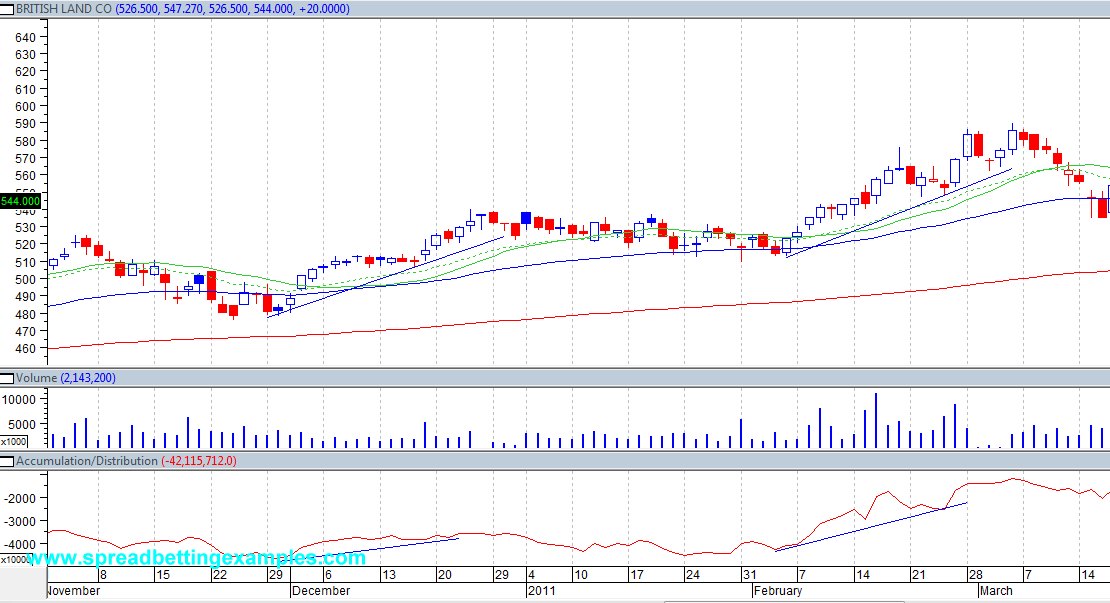
When volume increases or decreases with the prices this proves to be an effective price confirming tool. You can read up more on volume in the volume section.


In the Diagram below you can see how the accumulation distribution indicator confirms a rise in prices:


Accumulation Distribution: A warning tool


On the other hand a few weeks later in the same British Land, a spread better with access to volume information could have foreseen a turn around in prices. In fact:
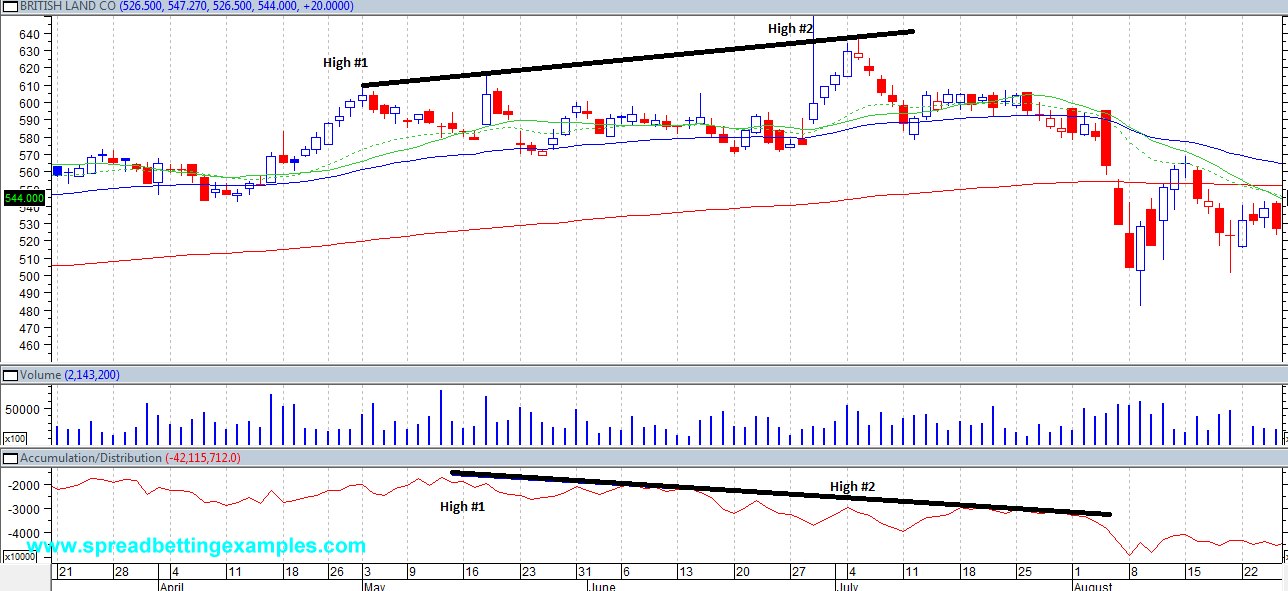
 

Look at the example above.

In British land we are making new highs, but this is not confirmed by the volume indicator the Accumulation distribution indicator which is instead making lower highs.

This is usually a sign of weakeness.


In conclusion Accumulation Distribution can be used as both a warning tool and a confirming tool.

It is important to add a volume indicator in your price analysis, other volume indicator you can use are the OBV (On Balance Volume), MFI (Money Flow Index), Chaikin Oscillator and the Price volume trend indicator.
Money Flow Index2

Trading with the Money Flow Index:

The Money flow index used as a warning signal tool:

The MFI is a good indicator of divergence and convergence as it has volume incorporated in it’s calculations. As volume is said to precede prices, it is a good indicator of when prices are turning.

Bearish divergence is when prices are rising but volume is declining, that is: volume is less that other up days.

Bullish divergence is when prices are falling but volume is increasing, that is: volume is greater than in other down days.


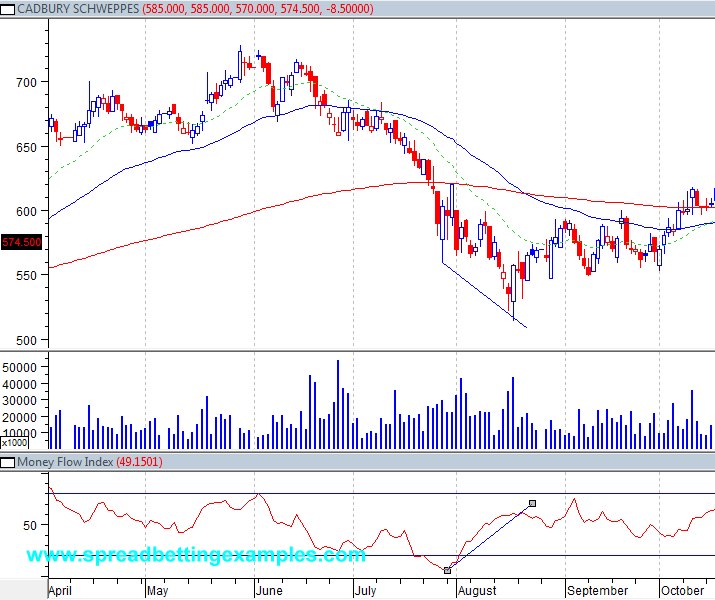
Bullish Divergence:

As you can see from the Cadbury Schweppes graph (CBRY.L), prices were making new lows, instead the money flow index was making new highs on the strong volume.

This would have been a good opportunity to spread bet a long position as soon as the bullish engulfing pattern was completed confirming the bullish divergence.


Bearish Divergence:


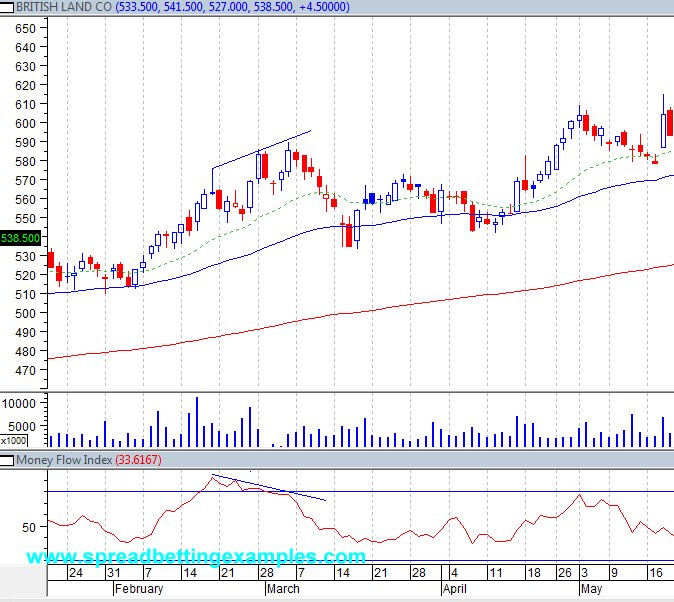
Instead in British Land (BLND.L) we can see the opposite pattern occurring. Prices are making new highs but this is not confirmed by the money flow index that is making lower highs. As you can also see this is replicated in the volume, lower highs.

This alerted spread betters to get ready to short the market. In fact as you can see the sign of weakness is confirmed by the Harami pattern that form after the new highs.


As you can see above the Money Flow Index is an effective price confirmation tool and price reversal warning tool.


Previous Page:The Money flow index used as a warning signal tool


Money Flow Index

Indicator: Money Flow Index

Family: Oscillator

Money Flow index is a momentum oscillator based of the change of price and volume. This is based on a similar concept to the Accumulation and Distribution, normalized between 1 – 100 , to create an oscillator similar to the RSI and interpreted in the same way.  As an oscillator closely linked to volume it is best used to identify reversals and price extremes.


Calculations:

  • Typical Price: (High + Low + Close) / 3
  • Money Flow: Typical Price x Volume
  • Positive Money Flow: The Money Flow on days where the Typical Price is greater than the previous day’s Typical Price.
  • Negative Money Flow: The Money Flow on days where the Typical Price is less than the previous day’s Typical Price.
  • Money Ratio: Positive Money Flow / Negative Money Flow
  • Money Flow Index: 100 – [100 / (1 + Money Ratio)]


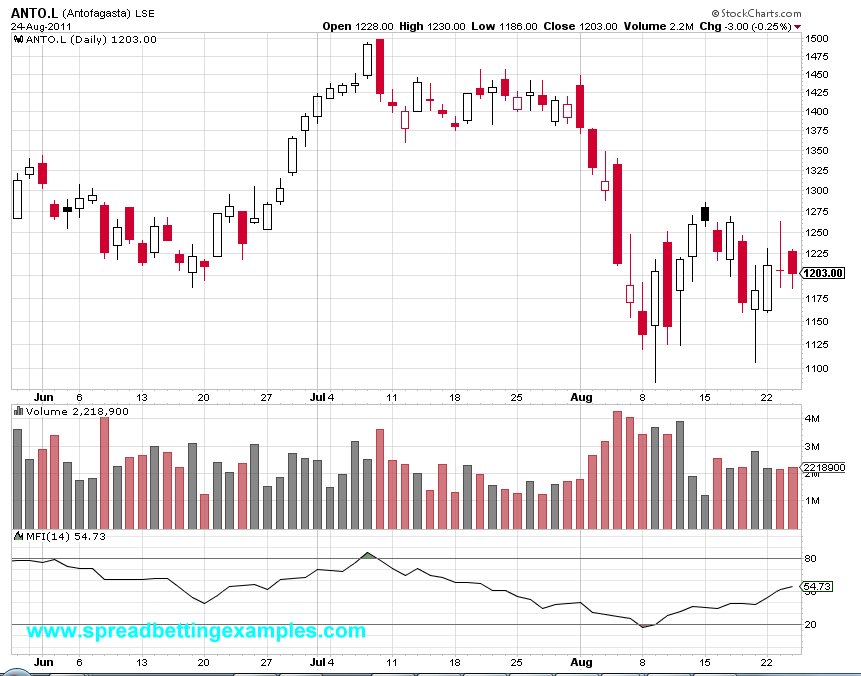
Example of the Money Flow Index:


Trading with the Money Flow Index:

Not many spread betting platform charts offer the Money flow index, but if you are using a private charting package that has volume indicated. You can spread bet referring to these charts

The Money flow index used as a confirmation tool:

  •  MFI < 20 – oversold
  • MFI > 80 – overbought

As an Oscillator bound between 0-100, a reading between 0 – 20 indicates that the indicator is oversold and a reading between 80 – 100 means the indicator is overbought.

When the indicator finds itself in the oversold region, traders should look to start covering their shorts.

When the indicator is in the overbought region, traders should start covering their long positions.


Next Page:The Money flow index used as a warning signal tool