Bollinger Bands mean reversion strategy

As we stated in our previous page the Bollinger Band is created by two bands around the 20 moving average centre line, and these two bands are the 2 standard deviation. In statistics, the 2 standard deviation contains 95.4% of the price movement. Normally,  the price will move away from the centre line towards the extremes and then snap back to the middle (The mean) like an elastic band. This snapping back is a “mean reverting strategy”. So when to spread bet long or short?

Mean reverting Spread Betting strategy

Long:

When the prices move down towards the lower band, this is when spread traders will either go long to open a new position or buy to close out their short position.

Short:

When the prices move up towards the upper band, this is when spread betters will either go short to open a new position or sell to close out their long position.


Below is a spread betting example of Xstrata (XTA.l) and how to trade the bands:

Xstrata (xta) -Bollingerbands mean reverting strategy(1)


The bands can be traded in many ways, above I have showed you a spread betting strategy, on the next page I will show you something completely opposite. When trading this mean reverting spread betting strategy, aggressive traders would enter as soon as the prices touch the bands, instead less aggressive spread traders would wait for the prices to turn around look for a candle that closes in the direction they want to trade, then take the trade.

For example, (in a long trade) when prices are falling a less aggressive trader would look for the prices to touch the lower band and the next candle to finish up not down, above the band. Then the trader would enter the  trade long, following a long spread betting strategy.


Closing your trade. Some spread traders will close the trade when it reaches the mean (middle line – 20 MA) others will wait for the prices to reach the above band. This all depends on your risk tolerance


Next, as we said we will show you the complete opposite.

Next:

Previous:

MACD-Moving Average Convergence-Divergence

The MACD developed by George Appel, is a very popular indicator. Personally one of my favourites. Below I will discuss three main spreadbetting strategies with the MACD. How it is calculated in three steps:

  1. MACD: Calculate the spread between a 26-Day EMA (Exponential Moving Average) – 12 EMA. This differential represents price velocity
  2. MACD Signal Line: 9 Day EMA of the MACD Line.
  3. MACD Histogram: The MACD minus the MACD Signal Line

The MACD is a very effective and popular tool. There are three main strategies used to spreadbet with the MACD.

  • MACD – Moving Average crossover
  • MACD – Divergences
  • MACH – Histogram

Next Page:Spread Trading the MACD – Moving Average Convergence Divergence

SpreadTrading the Momentum Indicator

Trading with the momentum Indicator:


 Trend Following

Some like trading with the strength in the Spreadbetting markets and take a long or short position once the Momentum indicator crosses the 50 line. The momentum indicator can be used in both scalping and swing trading. In scalping it would indicate in which direction to spread trade.

Long trade: when the momentum indicator crosses the an absolute value, (often the 50) line to the upside

Short trade: when the momentum line crosses to the downside.

Closing your trade. The momentum indicator is not a good indicator to use to close our trade, because by the time it crosses the 50 line again, most of our profits have been eaten away. You should apply always your money management rules, and look for the when the moment indicator is turning, this would be


Divergence Trading

The momentum indicator is a strong divergence indicator, as prices diminish on their uptrend or down trend velocity the momentum indicator will start turning, thus forming divergence. This is an important concept in technical analysis, the velocity of the price  movement is a leading indicator in a change of trend.


Bullish Divergence can indicate the end of a down trend.


Previous Page:The Momentum Indicator


Momentum Indicator

Momentum Indicator

The Momentum indicator is a very simple and straight forward indicator. It tells you essentially what has been the recent change between the price of your current spread bet and the previous price of n days ago. What this relationship tells you is if your current price is stronger or weaker than the previous price. It is very similar to the ROC (Rate of Change).

It is constructed in a very simple way. It is the current price, lets say of the FTSE , minus the price of the FTSE 20 Bars ago.


  • Current Price – the Price N days ago.


Therefore if the price is below the momentum indicator, we are seeing weakness of the FTSE vs. it’s price N days ago.

If instead the price is above the momentum indicator, we are seeing strength.


An example of the momentum indicator:

Momentum Indicator


page: 

Next Page:Trading with the momentum Indicator


Money Flow Index2

Trading with the Money Flow Index:

The Money flow index used as a warning signal tool:

The MFI is a good indicator of divergence and convergence as it has volume incorporated in it’s calculations. As volume is said to precede prices, it is a good indicator of when prices are turning.

Bearish divergence is when prices are rising but volume is declining, that is: volume is less that other up days.

Bullish divergence is when prices are falling but volume is increasing, that is: volume is greater than in other down days.


Bullish Divergence:

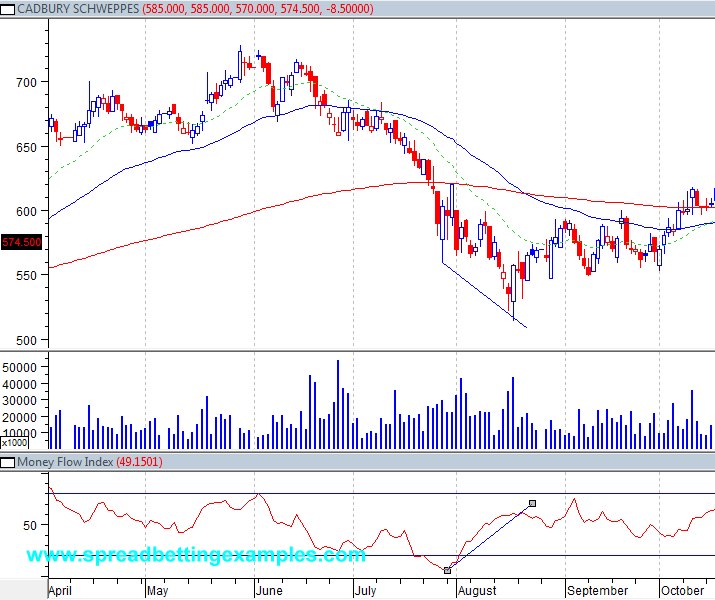
As you can see from the Cadbury Schweppes graph (CBRY.L), prices were making new lows, instead the money flow index was making new highs on the strong volume.

This would have been a good opportunity to spread bet a long position as soon as the bullish engulfing pattern was completed confirming the bullish divergence.


Bearish Divergence:


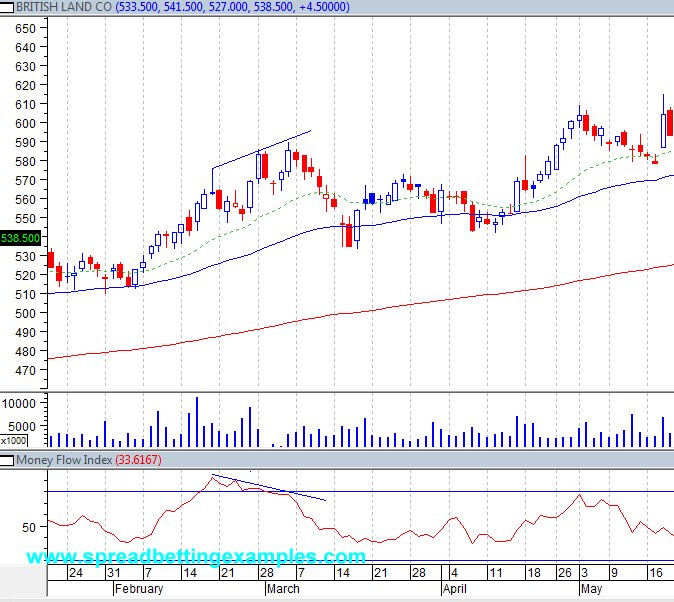
Instead in British Land (BLND.L) we can see the opposite pattern occurring. Prices are making new highs but this is not confirmed by the money flow index that is making lower highs. As you can also see this is replicated in the volume, lower highs.

This alerted spread betters to get ready to short the market. In fact as you can see the sign of weakness is confirmed by the Harami pattern that form after the new highs.


As you can see above the Money Flow Index is an effective price confirmation tool and price reversal warning tool.


Previous Page:The Money flow index used as a warning signal tool


Moving Average breakout- Spread Betting System

#1) Moving Average BreakOut

This is a very simple, effective and widey used spreadbetting strategy. Many professionals and non-professionals use the the Moving average to identify the trend of the trade, or direction to spreadbet.

Time frame:any. Preference 1hr, 4hr Daily
Tag: Day Trading, Swing Trading, Long term trading
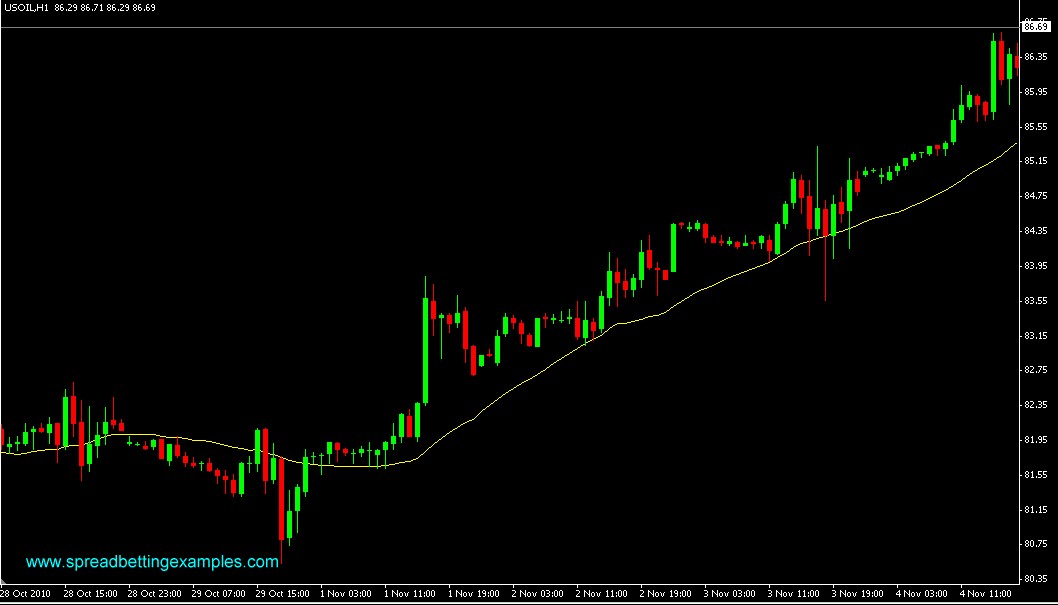
Trading Indicators used: Simple Moving Averages 25 SMA (also widely used 200 MA, 100MA, 55MA)
Charts used: Any. Preference: Dow, GBP/USD, WTI Crude

Entry Rules:When the candlestick of the time frame you are trading closes above the Moving Average, You can take a long position in your online spread betting account.

If instead the candlestick of the time frame you are trading closes below the MA, take a short position in your online spreadbetting account.

Exit Rules: You can use your money monangement rules, that is placing a stoploss at a certain % loss of your accounts or once the trade has turned around a certain number of points. This is you discreation.

Others wait for a sell signal to change the position around. This will always keep you in the market. When the market is not trending you could suffer a lot of turn arounds.

Professional traders use Moving Average Breakout strategy to help them determine the trend. If the trading occurs above the Moving average. They prefer spread trading to the long side, and vice-versa. The most common and widely used Moving averages are the 200 MA, 100AM, 55 MA and 25 MA.

Advantages: You Spread trade with the trend. Going against the trend could put you in difficulty.

Disadvantages: The moving average is a lagging indicator, and it can put you late into a trend.

Spread betting Examples

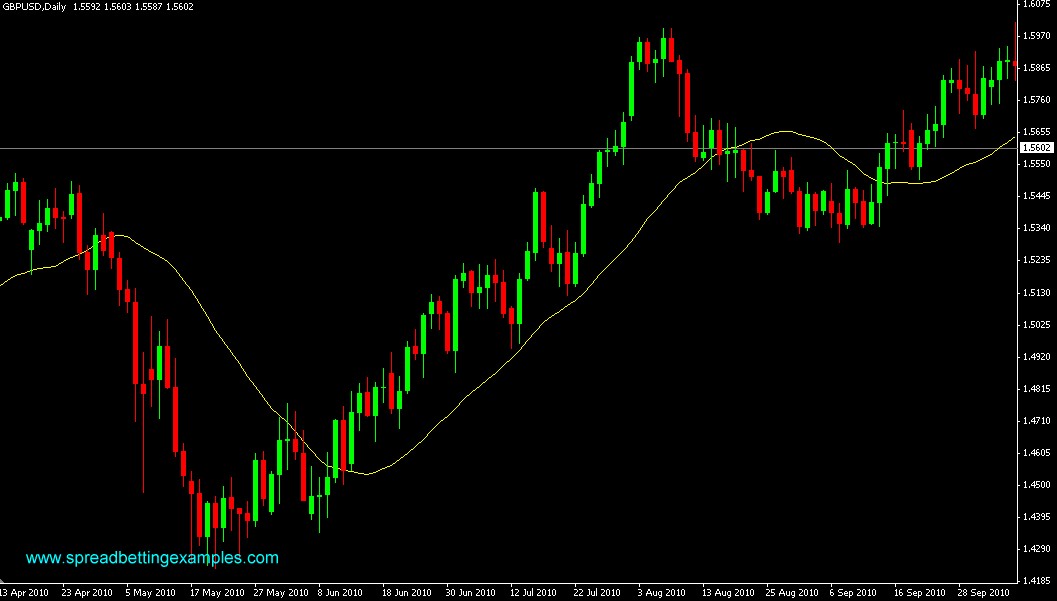
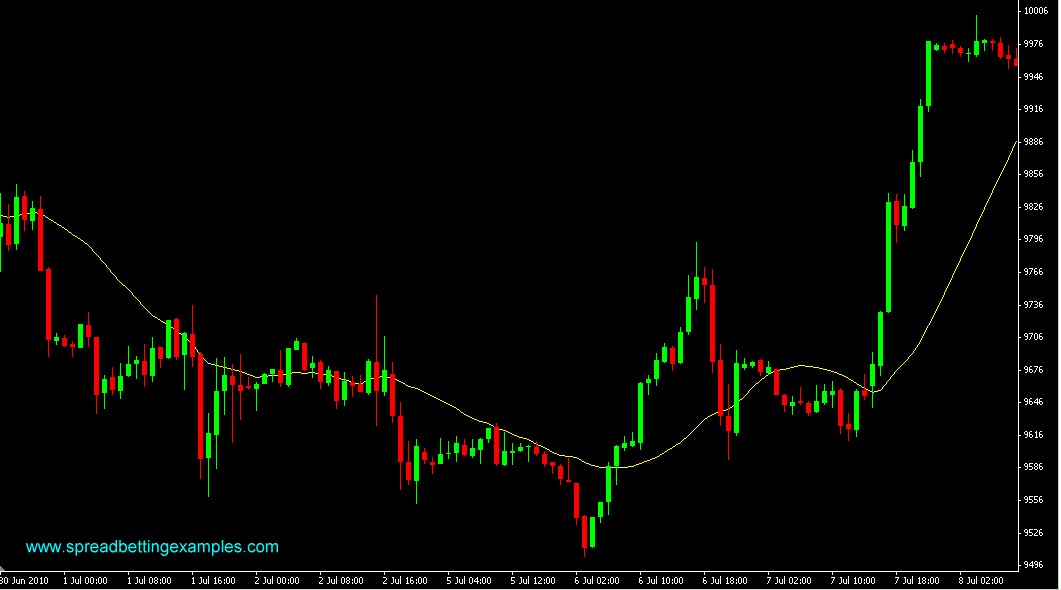
25MAis on  GBP/USD Daily &  1hr on DAX and  WTI Crude