Parabolic SAR

The Parabolic Time/Price System or better known as the Parabolic SAR is an entry and exit system created by J.Wells Wilder. SAR = “Stop and Reverse” .

It combines price and time components to generate your spread betting long or short signals. The Parabolic SAR adapts to the change. It is also an effective tool to determine where to place your stop loss.

GBPUSD -Parabolic SAR indicator


Long Spread Trading Signal

When to take a long spreadbetting strategy? When the candle finishes above the Parabolic SAR and the Parabolic SAR indicator changes from being above the price to being below the price.  The Parabolic SAR indicator was used as a stop and reversal trading strategy, where you would not close your position but would turn it around from a long to a short trading. The Parabolic SAR Indicator can be applied to Forex, stocks, indices,


Short Spread Trading Signal

Opposite to your long trading strategy, When the candle finishes below the Parabolic SAR and the Parabolic SAR indicator changes from being below the price to being above the price, this is the signal to go spreadbet short.


Now the next page will show you how the Parabolic SAR is extremely useful for knowing where to place your stop loss.


Next: Parabolic SAR Stop loss

Momentum Indicator

Momentum Indicator

The Momentum indicator is a very simple and straight forward indicator. It tells you essentially what has been the recent change between the price of your current spread bet and the previous price of n days ago. What this relationship tells you is if your current price is stronger or weaker than the previous price. It is very similar to the ROC (Rate of Change).

It is constructed in a very simple way. It is the current price, lets say of the FTSE , minus the price of the FTSE 20 Bars ago.


  • Current Price – the Price N days ago.


Therefore if the price is below the momentum indicator, we are seeing weakness of the FTSE vs. it’s price N days ago.

If instead the price is above the momentum indicator, we are seeing strength.


An example of the momentum indicator:

Momentum Indicator


page: 

Next Page:Trading with the momentum Indicator


Commodity Channel Index (CCI)

Technical Indicator: Commodity Channel Index (CCI)


The Commodity Cannel Index (CCI) is a very popular indicator used mainly to show overbought and oversold areas. Developed by Donald Lambert mainly for commodities, it is not used on a wide variety of products. The CCI measures the current price relative to an average price, usually 20 prices. These have been created so that between +100 (overbought) and -100 (Oversold) they represent 75% of the price movement.

Often found on most spreadbetting charting packages as there is no volume involved. It is very easy to apply to your spreadbet charts.


Next Page:Trading the Commodity Channel Index (CCI)

Average Directional Index (ADX)2

Trading Signals:

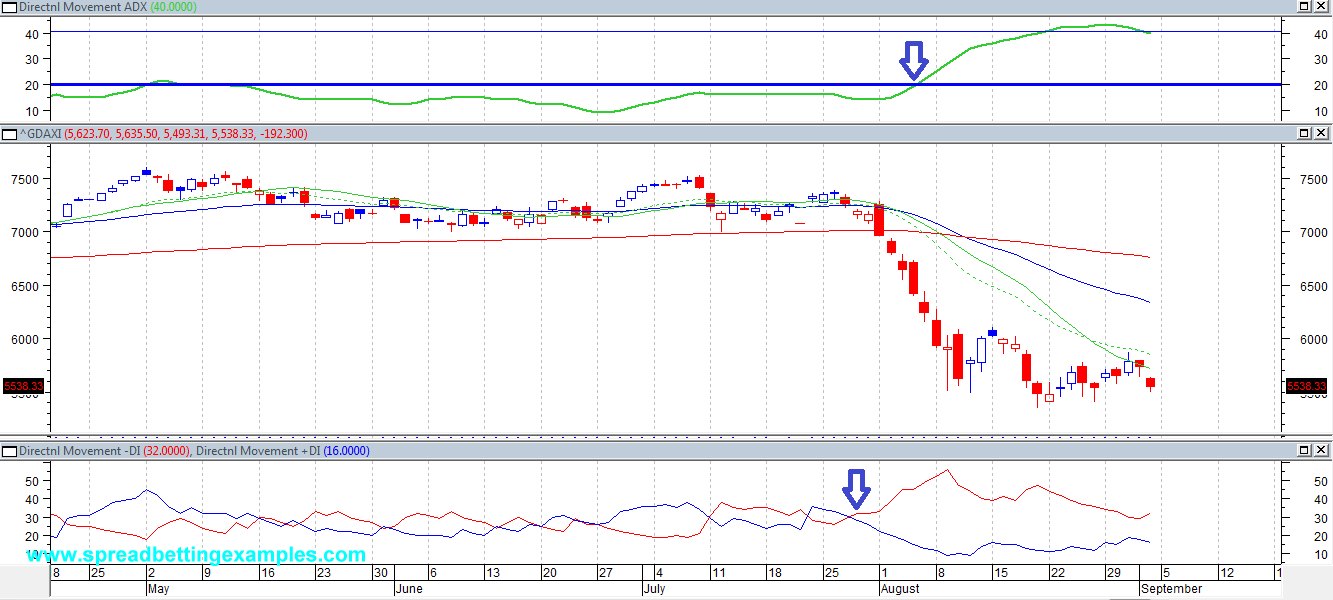
+DI Cross –DI

The +DI compares the two consecutive highs and the –DI compares the two consecutive lows.

Wells Wilder states:

-when the ADX >20 and the + DI is above the –DI. Trade/spread bet Long:

-when the ADX >20 and the -DI is above the +DI. Trade/spread bet short:

example:


Combining the ADX with other Indicators:

 Ranging Market: Oscillators

Oscillators: When the ADX < 20, this tells us the market is ranging. In a Ranging market the most effective Indicators to use are Oscillators. When markets start trending again these are no more effective. Common oscillators: Bollinger Bands, Moving Average envelopes, RSI, Slow or Fast Stochastic.


Trending Market: Moving averages

 When the ADX >20, the market is trending.  In a Trending market the most effective Indicators to use are Averages. These keep you in a trend for the long run. An effective strategy that an be used to spread bet the EURUSD is the 3 EMA cross and ADX

Previous Page:The Average Directional Index (ADX) trading signal