Double 14 EMA and Parabolic SAR

Spread betting system Double 14 EMA and Parabolic SAR

This system is quiet simple to follow.  You have three spreadbetting indicators setup on your charts:

EMA 14 on the high
EMA 14 on the low
Parbolic SAR

Spread betting system

Spreadbet Long when the prices break above the EMA 14 high and close above. The Parabolic SAR must be below the prices and vice versa: Spreadbet short when the prices break to the downside below the EMA 14 low and the Parabolic SAR is above the price. For those

Time Frame to use: You can try this system on various time frames, as long as when you apply your stoploss you know what 1 Average Unit of trading is. Example, I have applied this system to the DAX 1 HR chart, and the average movement of the germany30 is 30 points.

Risk/Stoploss: My stop loss that I apply is around 40 points and I look for a target of 40 – 60 points, depending on how strong the news is in the market

Important is that you apply rigidly your money management rules as like many moving average cross systems this works wonders in a trending moving market or a market that has a lot of news. Try to avoid trading during big news announcements as there will be a lot of whipsaw volatility in the markets

********************************

Type:Trend preferably /reversal
Timeframe of trade: Swing

********************************

see the Spread betting example below see
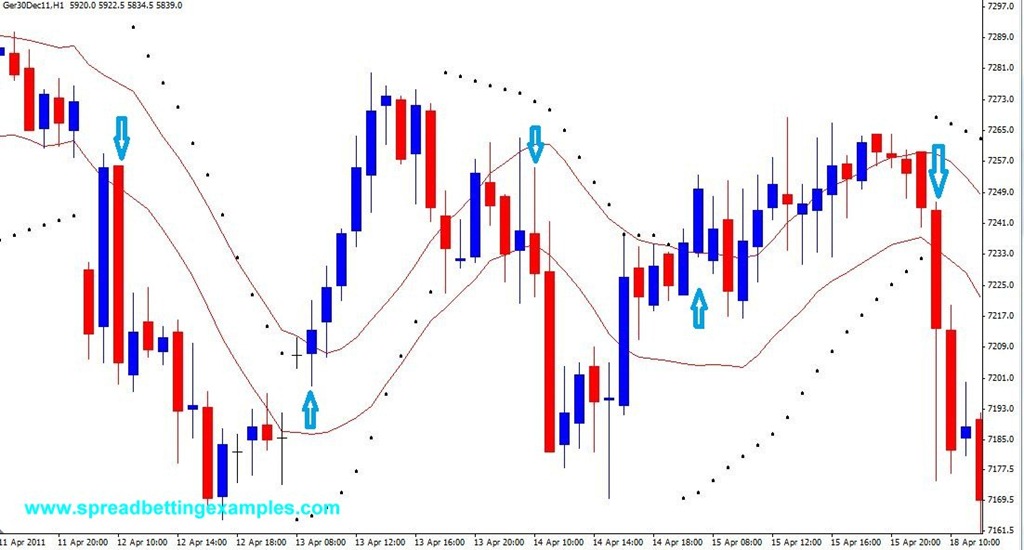
Double EMA and PARSAR_

********************************

This spread betting system of the Double 14 EMA and Parabolic SAR can be applied to any instrument (FTSE, DJI, S&P, Forex: EurUsd, GBP, JPY, AUD, CAD, CHF, Commodities: Oil, Gold, Shares )as long as you apply good money management rules and it is a market that has movement.

Back to

Parabolic SAR

The Parabolic Time/Price System or better known as the Parabolic SAR is an entry and exit system created by J.Wells Wilder. SAR = “Stop and Reverse” .

It combines price and time components to generate your spread betting long or short signals. The Parabolic SAR adapts to the change. It is also an effective tool to determine where to place your stop loss.

GBPUSD -Parabolic SAR indicator


Long Spread Trading Signal

When to take a long spreadbetting strategy? When the candle finishes above the Parabolic SAR and the Parabolic SAR indicator changes from being above the price to being below the price.  The Parabolic SAR indicator was used as a stop and reversal trading strategy, where you would not close your position but would turn it around from a long to a short trading. The Parabolic SAR Indicator can be applied to Forex, stocks, indices,


Short Spread Trading Signal

Opposite to your long trading strategy, When the candle finishes below the Parabolic SAR and the Parabolic SAR indicator changes from being below the price to being above the price, this is the signal to go spreadbet short.


Now the next page will show you how the Parabolic SAR is extremely useful for knowing where to place your stop loss.


Next: Parabolic SAR Stop loss

Parabolic SAR Stop loss


As we mentioned earlier the Parabolic SAR Technical Indicator can function as an area where to place your stoploss, this is both to protect your wins while the trend increases or to minimize your loss when the trend goes against you.

GBPUSD -Parabolic SAR as stoploss

The Effectiveness of the Parabolic SAR as a stop loss tool:

1) Initial stop loss

As the market turns around the Parabolic SAR indicates where to place your initial stop loss above or below the stock, indices, commodities trading price. This is placed according to your spread betting strategy, as in the spread betting example above.

2) Trailing stop loss

As the stock, indices, commodities trading price moves higher so does the Parabolic SAR, as it is an adaptive indicator that follows the price trend. It has an Acceleration Factor of 0.02, that is, as prices move higher so does the Parabolic SAR. This giving new levels where to put your stop loss.

3) Protective Stop and Time stop

as the prices move against you, you have protected your profits.

We said the Parabolic SAR indicator is also a Time stop, as time goes by and the prices move higher until they stop behaving as they should, the Parabolic SAR moves closer and closer until it changes direction, letting you out of the trade. thus time is a big factor too in the Parabolic SAR indicator.


This is good spread betting tool to add to your spread trading bag of indicators.