FTSE100 BB Scalping strategy

Scalping Strategy–FTSE100  5 min Bollinger Bands scalping

Here is a very simple strategy but you do need to familiarize yourself with this strategy before you start using this strategy. It can be effective as it can stop you out quiet frequently. You can trade this on the FTSE100 on a 1min, 5min, 15 min time frame.

Do Not trade this ahead of important data or news.  Do Not Trade when there is a lot of strong bad news or good news in the market as the FTSE100 is likely to take a direction. Best to trade it after the FTSE open and before the 13.30 economic data or US open.  Unless the economic data that is coming out has no importance.

Settings:
Bollinger Bands 50 period, 2 Standard deviation (magenta)
Bollinger Bands 50 period, 3 Standard deviation (blue)
Bollinger Bands 50 period, 4 Standard deviation (orange
)

Spread betting Rules:
Go Long
when the price crosses the first Bollinger Band (magenta) to the downside, moving towards the second Bollinger bands (Blue), when it fails to reach the blue band and moves back up, this is when you go long, with your stop loss below the low the candle.
If, instead, the prices cross the blue Bollinger band moving lower towards the orange Bollinger band but fail to break the orange band and moves back up towards the centre of the bands, again this is where you buy and go long with stoploss below the low of the candle. Remember, this time while the prices were moving lower they must not have stalled between the magenta and blue. If you get stopped out, just wait for the next signal.

Go short when the opposite happens.
Scenario A. Prices move higher breaking the magenta bollinger band but failing to reach the blue bollinger band. It moves back towards the centre of the bands, go short with stoploss just above the band.
Scenario B. Prices moves past the magenta and blue bands to then stall between blue and orange. At this point, as prices move back into the bands, tanke a short trade with stio above the spike candle.

In both scenarios, being patient and waiting for the correct setup, is the key to trading.

Ideal scenario: when the markets are trading sideways, or the market is quiet with news to come out in a few days and prices are mainly moving sideways with occasional runs up or down.

What to be careful with this is when there is very strong news and the FTSE100 takes a direction. This is a mean reversal strategy, and we don’t want the FTSE100 to move in one direction.


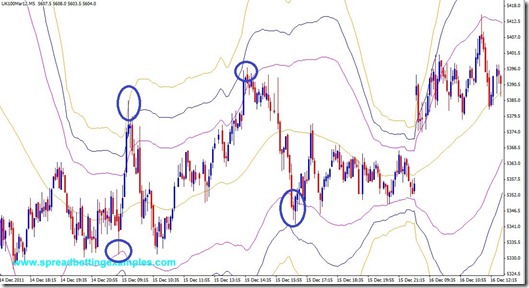
Below is a when the strategy works really well. Prices break the first bollinger band then retraces.
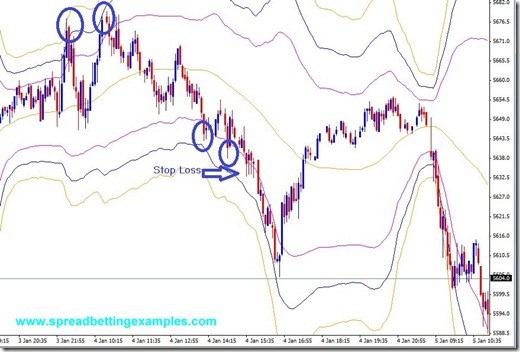


This is a second example of this . Here we get stopped out as soon as prices move in a trend. As you can see from the time, it is after 13.30. There was economic data that made the markets take a trend.
Any queries, post a comment and I will be happy to answer

Back to

Double 14 EMA and Parabolic SAR

Spread betting system Double 14 EMA and Parabolic SAR

This system is quiet simple to follow.  You have three spreadbetting indicators setup on your charts:

EMA 14 on the high
EMA 14 on the low
Parbolic SAR

Spread betting system

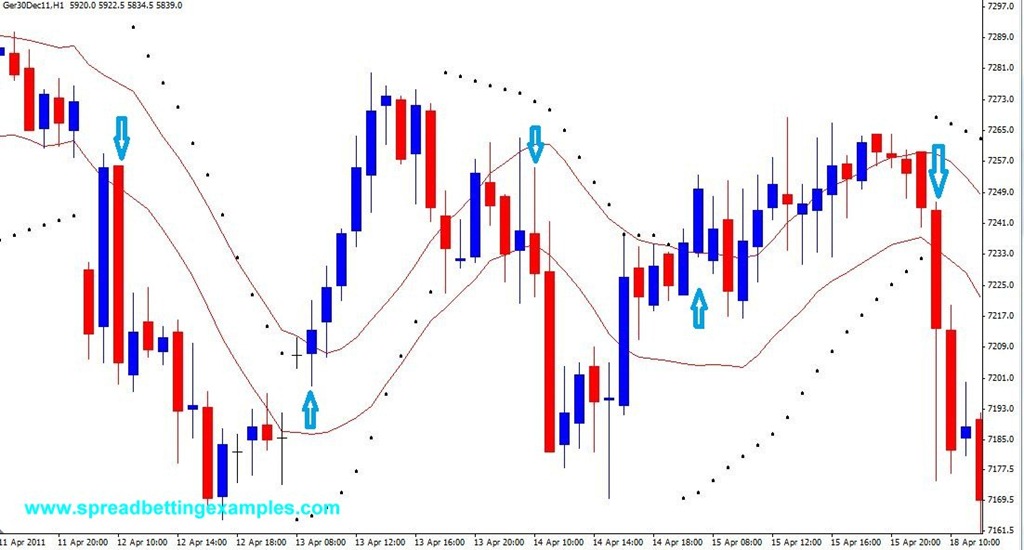
Spreadbet Long when the prices break above the EMA 14 high and close above. The Parabolic SAR must be below the prices and vice versa: Spreadbet short when the prices break to the downside below the EMA 14 low and the Parabolic SAR is above the price. For those

Time Frame to use: You can try this system on various time frames, as long as when you apply your stoploss you know what 1 Average Unit of trading is. Example, I have applied this system to the DAX 1 HR chart, and the average movement of the germany30 is 30 points.

Risk/Stoploss: My stop loss that I apply is around 40 points and I look for a target of 40 – 60 points, depending on how strong the news is in the market

Important is that you apply rigidly your money management rules as like many moving average cross systems this works wonders in a trending moving market or a market that has a lot of news. Try to avoid trading during big news announcements as there will be a lot of whipsaw volatility in the markets

********************************

Type:Trend preferably /reversal
Timeframe of trade: Swing

********************************

see the Spread betting example below see

Double EMA and PARSAR_

********************************

This spread betting system of the Double 14 EMA and Parabolic SAR can be applied to any instrument (FTSE, DJI, S&P, Forex: EurUsd, GBP, JPY, AUD, CAD, CHF, Commodities: Oil, Gold, Shares )as long as you apply good money management rules and it is a market that has movement.

Back to

Heiken Ashi and Ichimoku cloud

Advanced Spread betting system- Heiken Ashi and Ichimoku cloud

I found this strategy on Forex factory. I have tried it on smaller time frames, but will run the spread betting system on a higher Time frame. This system is part of the as those who apply it should have some understanding of the (Ichimoku cloud) charts and the . I have added a brief explanation in the technical Indicator section.

Description
This is a relatively easy spread betting system. It requires a lot of patience, as more indicators you use the greater the patience needed for the signal to occur. I applied this strategy on the GBPJPY.

Spread-betting long:
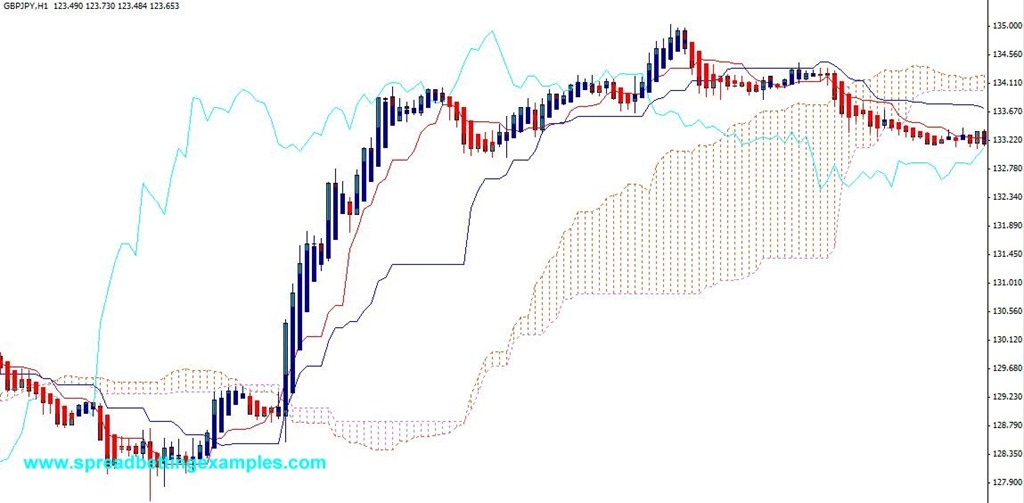
The signal: Wait for the Heiken Ashi candlestick bust be above and close above the Kumo. Once the Tenkan Sen has crossed above the Kijun Sen; The Chikou Span must be above the prices and heading higher. Instead in the cloud, the Senkou Span-A would have crossed above the Senkou Span-B; Heiken Ashi candlestick must be  positive blue candle.
For those that have a higher risk tolerance they can ignore the Chikou Span.

Trading system - Heiken Ashi and Ichimoku buy signal


Spread-betting short:
On the other hand we have a spread bet short which is completely the opposite to the spread betting long. Entry signal would be:
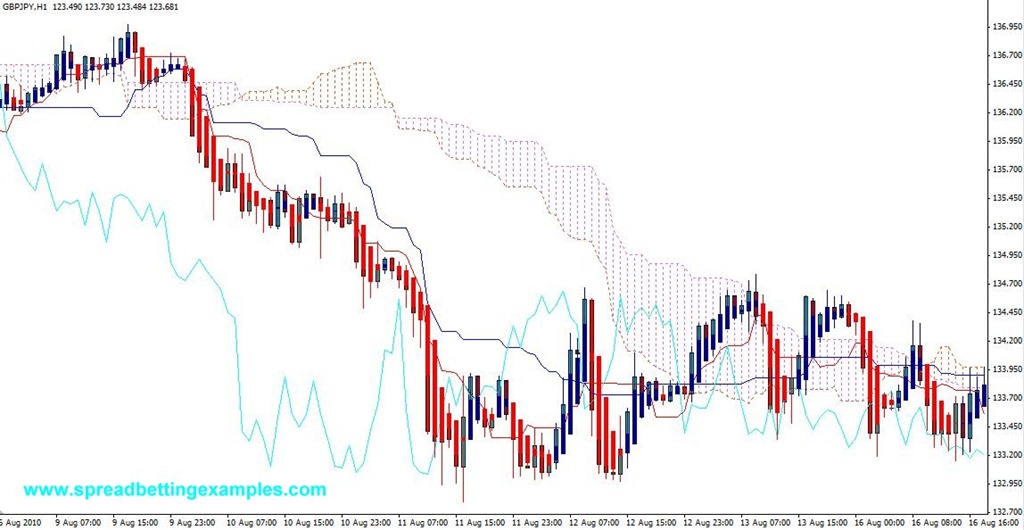
Wait for the Heiken Ashi candlestick bust be below and close below the Kumo. The Tenkan Sen would have crossed the Kijun Sen to the downside; the Chikou Span must be below the prices and heading lower. Instead in the cloud, the Senkou Span A would have crossed the Senkou Span B  to the downside; Heiken Ashi candlestick must be  a negative red candle.

Trading system -Heiken Ashi and Ichimoku sell signal


Your exit strategy:
You will exit either when your money management rules, tell you. Do not risk more than 2-5% of your account or if the trade goes your way wait for the Tenkan Sen to cross the Kijun Sen in the opposite direction.
This is a trend following strategy so you want to try stay in as long as possible.

********************************
Time frame: 1Hr
Tag: GBPJPY
Indicators used : (Ichimoku cloud) and the .
Charts used: GBPJPY
Type:Trend
Timeframe of trade: Swing
********************************

Back to