RSI (Relative Stregnth Index)

#3) RSI (Relative Stregnth Index)

Charts used:FTSE  , Cac30 , Barclays , S&P
Tag: Scalping, Day Trading, Swing Trading
Indicator: RSI – Relative Strength Index
Time frame: Any.

No trading system can rely only on the RSI indicator, but should be used in combination with other indicators or price action. The RSI can give you an edge in your spread betting technique. Before attempting this strategy, read The RSI: The Relative strength article.

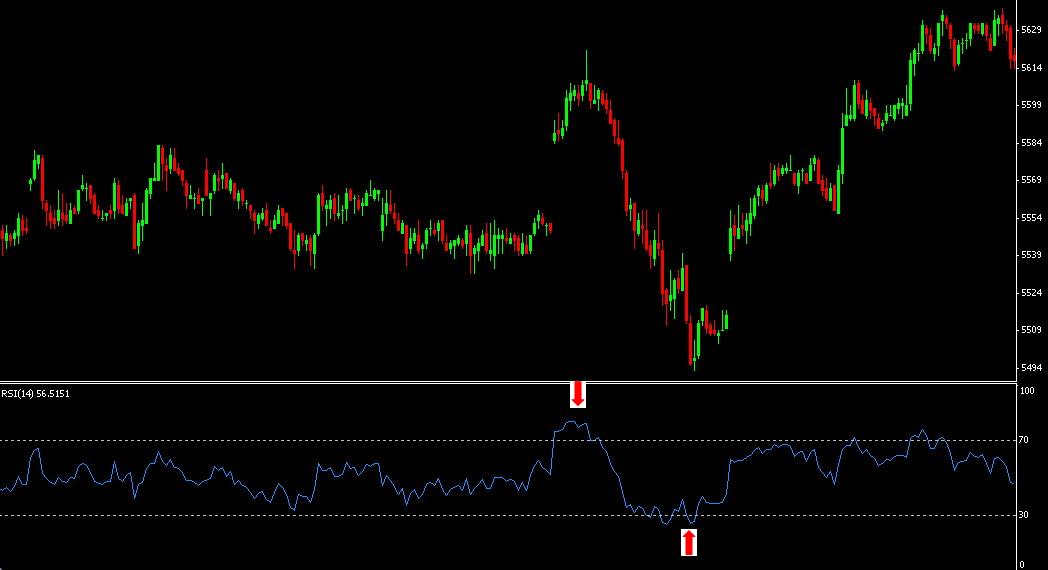
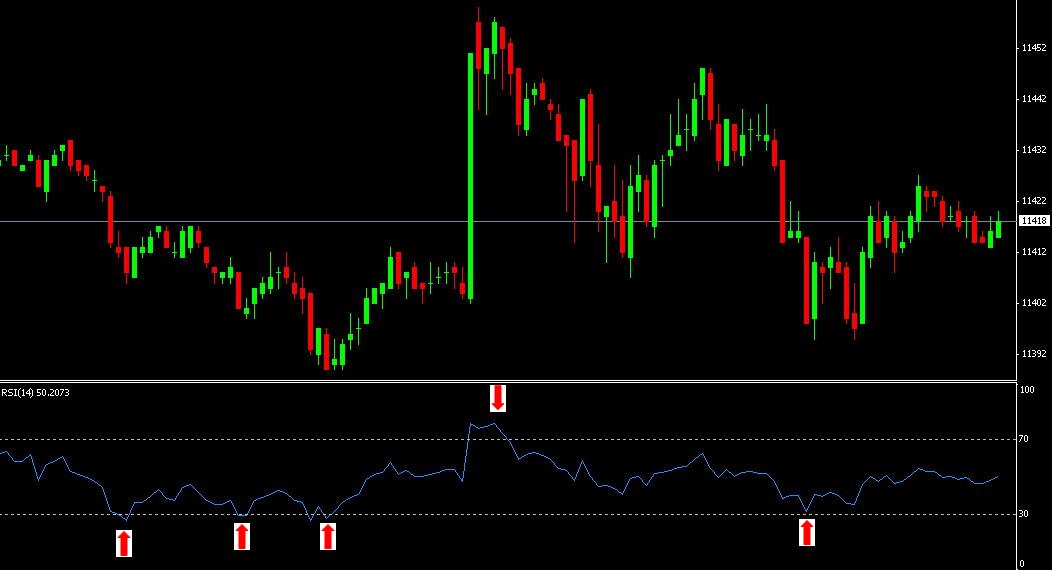
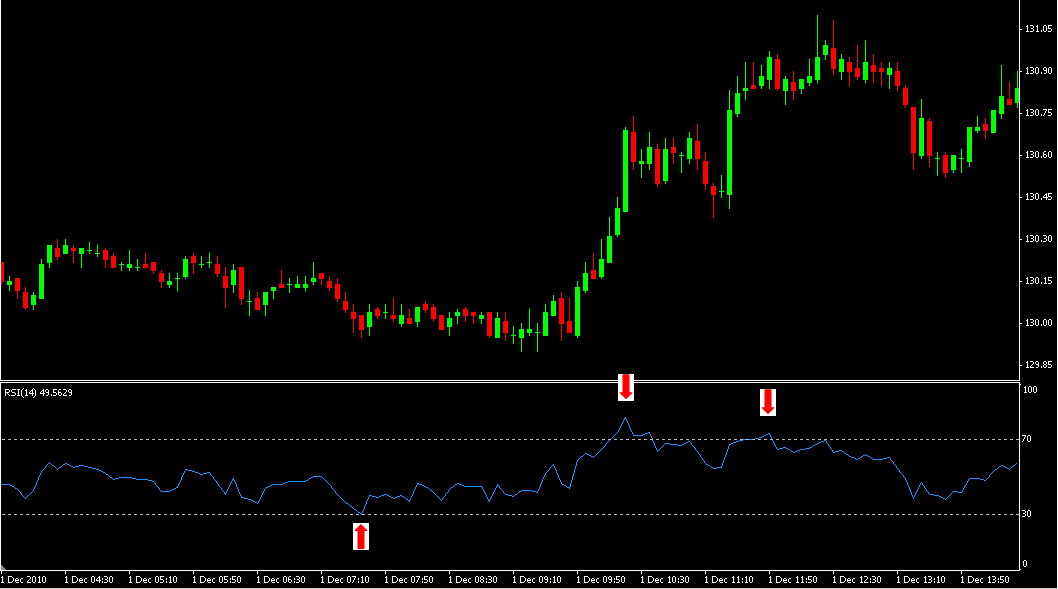
We set the RSI at a period of 14 and monitor the levels 70 and 30.(The RSI is an Oscillator and above 70 indicates that the prices are overbought, below 30 indicates that the prices are oversold).

Entry rules: Buy when the RSI crosses below 30, forms or has formed a bottom, and then crossed back up through 30.
Sell when RSI has crossed above 70, formed a peak, and then crossed back down through 70.

Exit rules: not set. Or use your money management

Advantages: RSI is a very good indicator to refer for confirmation when you are ready to enter a trade in any simple or complex trading system. Best used when trying to trade in a contratrend or or range trading market. In a trending market the RSI, can give false signals.

Disadvantages: You need to monitor your trade, as the RSI alone can give false signals when the market is trending. The RSI Oscillator should be used in combination with other indicators.

Financial Spreadbetting techniques and Tips on how to use the RSI:
Moving Average breakout- Spread Betting System

#1) Moving Average BreakOut

This is a very simple, effective and widey used spreadbetting strategy. Many professionals and non-professionals use the the Moving average to identify the trend of the trade, or direction to spreadbet.

Time frame:any. Preference 1hr, 4hr Daily
Tag: Day Trading, Swing Trading, Long term trading
Trading Indicators used: Simple Moving Averages 25 SMA (also widely used 200 MA, 100MA, 55MA)
Charts used: Any. Preference: Dow, GBP/USD, WTI Crude

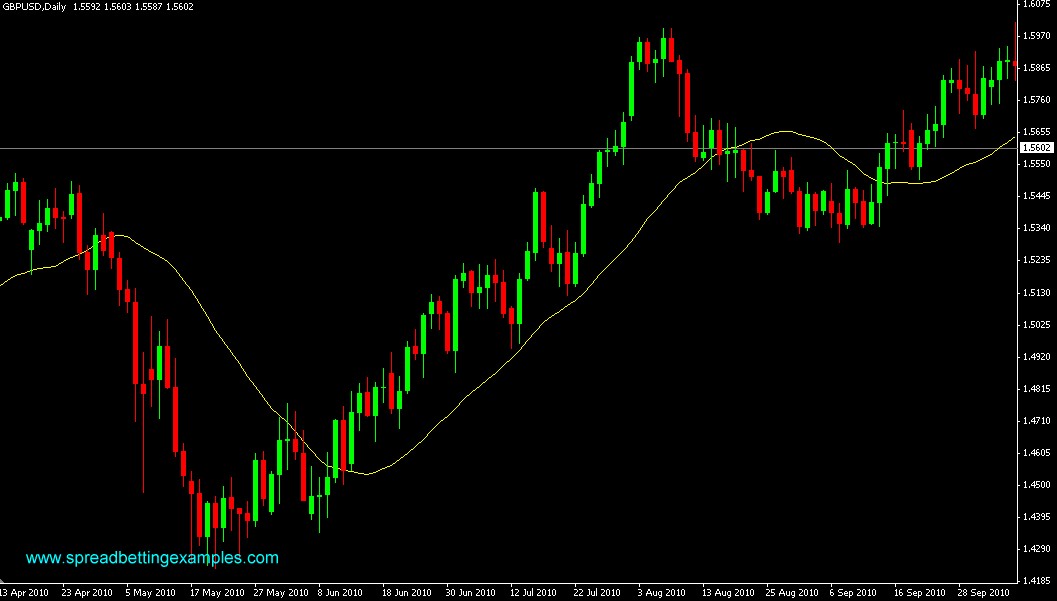
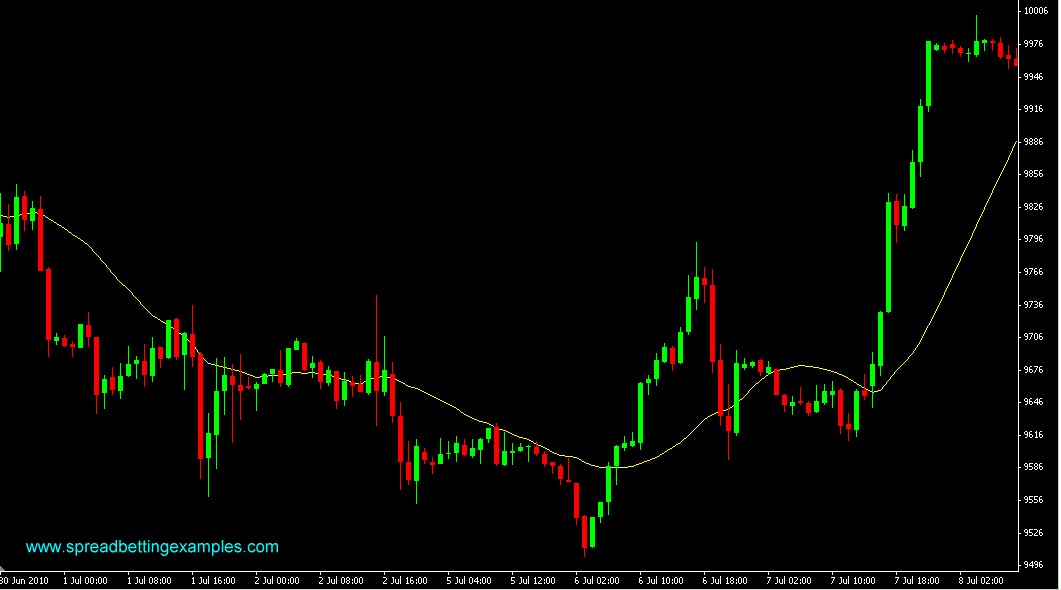
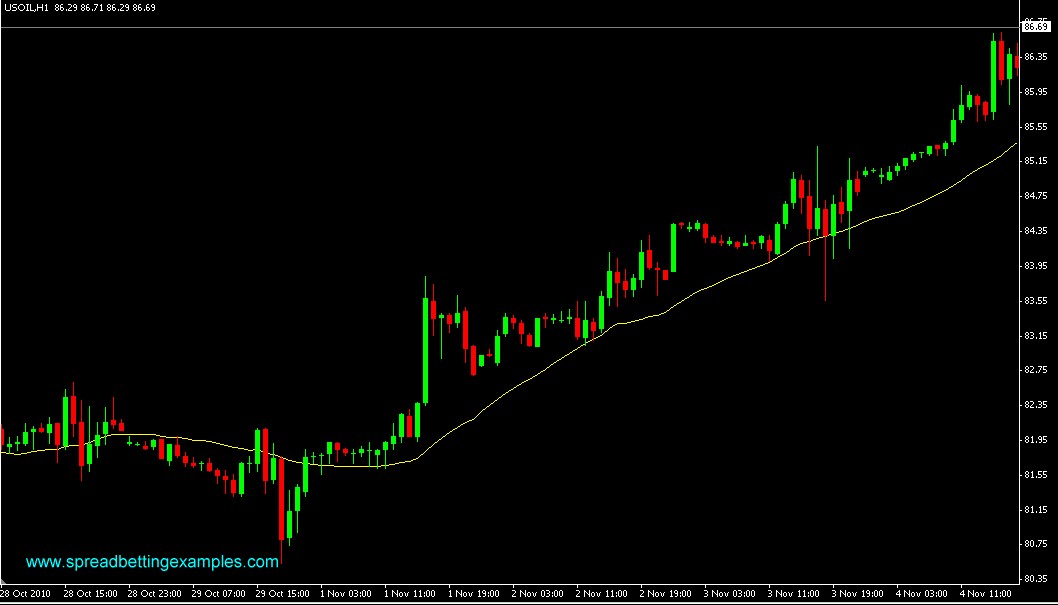
Entry Rules:When the candlestick of the time frame you are trading closes above the Moving Average, You can take a long position in your online spread betting account.

If instead the candlestick of the time frame you are trading closes below the MA, take a short position in your online spreadbetting account.

Exit Rules: You can use your money monangement rules, that is placing a stoploss at a certain % loss of your accounts or once the trade has turned around a certain number of points. This is you discreation.

Others wait for a sell signal to change the position around. This will always keep you in the market. When the market is not trending you could suffer a lot of turn arounds.

Professional traders use Moving Average Breakout strategy to help them determine the trend. If the trading occurs above the Moving average. They prefer spread trading to the long side, and vice-versa. The most common and widely used Moving averages are the 200 MA, 100AM, 55 MA and 25 MA.

Advantages: You Spread trade with the trend. Going against the trend could put you in difficulty.

Disadvantages: The moving average is a lagging indicator, and it can put you late into a trend.

Spread betting Examples

25MAis on  GBP/USD Daily &  1hr on DAX and  WTI Crude


Moving Average Crossover- Spread Betting System

#2) Moving Average Crossover


Time frame: 30 min, 1 Hr, 1 Day
Tag: Day Trading, Swing
Trading Indicators used: Simple Moving Averages, 7SMA, 14 SMA, 21 SMA
Charts used: FTSE, Silver, Dax

This system is a simple system, it can be used in day trading with smaller time frames, like 15min, 30min, to 1 hr charts, or in swing trading using 1 hour, 4hr, or daily charts

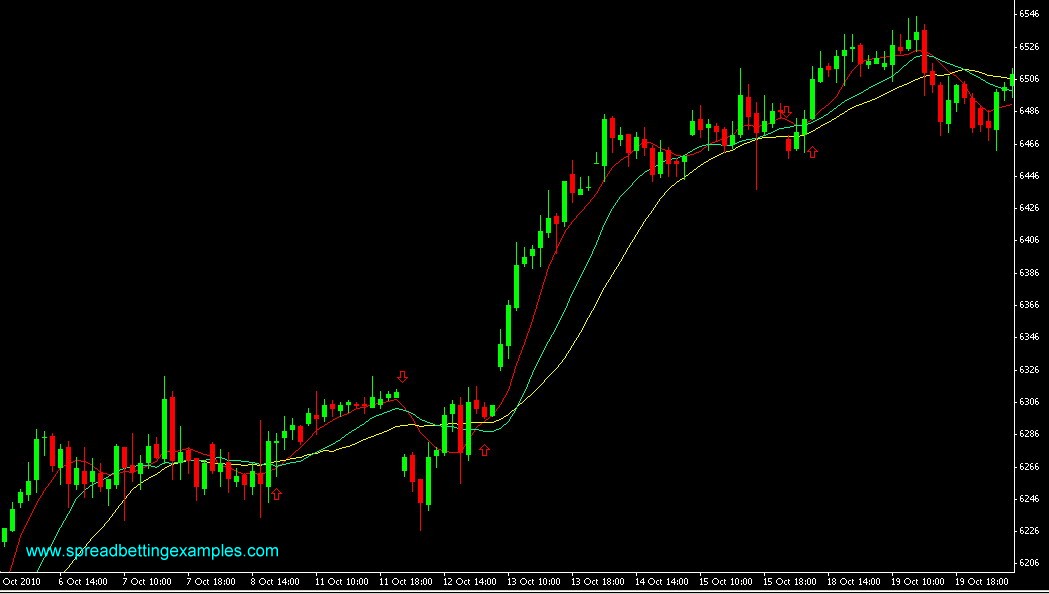
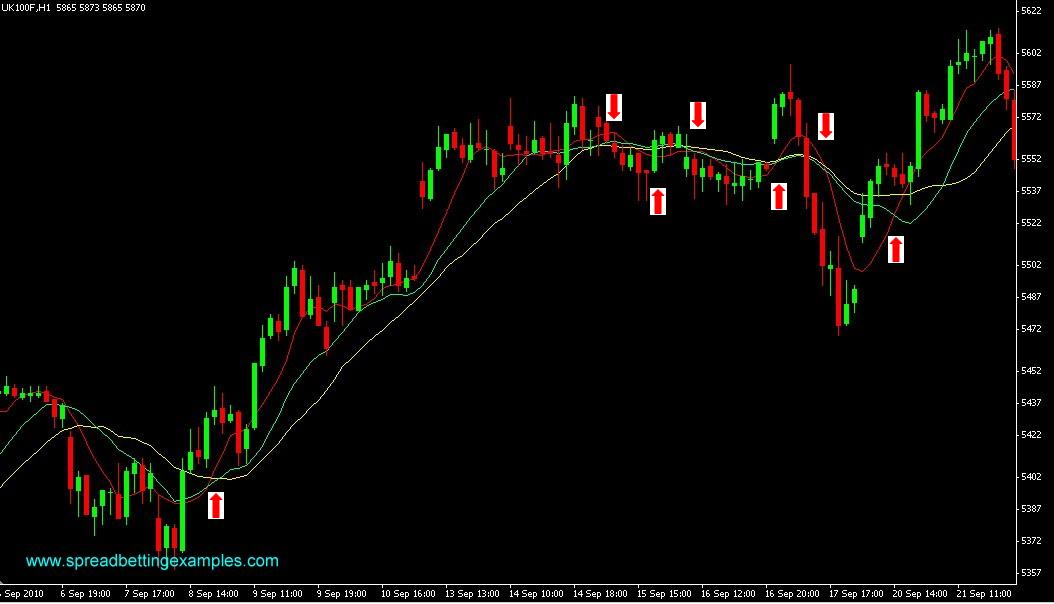
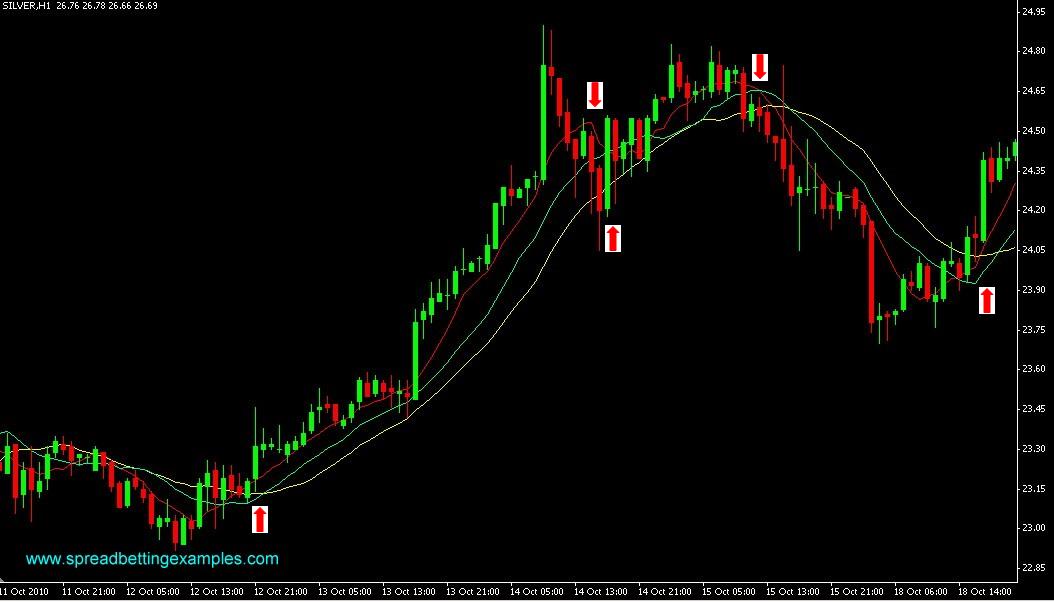
Entry Rules: Go Long, when the 7 SMA crosses the 14 SMA upwards and continues to move through the 21 SMA, buy.

Go Short, when the 7 SMA crosses the 14 SMA downwards and continues to move lower through the 21 SMA, take a short spread bet position.

Don’t try to anticipate the signals, and look at  your charts historical behavior when these three Moving averages have crossed, what the out come has been. This will help you identify, when applying this strategy to a different market, if this strategy works on the current market you are trading. If you want earlier signals you can decrease the 7 MA, and if

Exit Rules:

When the 7 SMA goes back and touches the 21 SMA. Don’t forget to apply your money management rules.

Advantages: This is a simple strategy, easy to set up with many Spread Betting brokers and does not need any calculations or other studies. Can produce very good results during strong market moves, the system also can be easily programmed and traded automatically.

Disadvantages: System requires periodical monitoring, as it can give false breakouts. SMA is a following indicator  and can give a late signal or the current price bar has been fully formed and closed. In choppy  markets it can give false signals but in trending markets this will keep you in trend.

Here are three examples of the strategy above:

DAX Moving Average cross Spreadbetting strategy

FTSE  Moving Average cross Spreadbetting strategy

Silver Moving Average cross Spreadbetting strategy

Welcome to Spread betting examples

Welcome to spread betting examples this site is meant for those spreadbetting traders that have some knowledge of what financial spread betting is, to help generate other trading ideas.

If you are new to spread betting don’t worry, we will also link or give full explanations of how to spread bet and of  what various technical analysis  terms mean.

We put together our trading knowledge  and other people’s knowledge into this site.

You will find here also the abc of trading, with many different trading styles like, Scalping,   Day trading,   Swing Trading,   Long term trading.  The website is also rich of examples in Financial spread betting  Indices,    Shares Commodities,   Oil,    Gold,   FTSE,   Dow,   Dax, forex, EUR/USD,   Gbp/usd and much more.

I hope you enjoy the tips and ideas, feel free to share your strategies too.

SB