CCI -1 Min Scalping System

CCI -1 Min Scalping System

This is Forex spread betting scalping strategy, I have used it on an MT4 but can also be applied to other charts
Trade From 8am UK time to 16 UK Time

Time Frame: 1 min

Forex Spread Betting Rules:

Trade Long:
Indicator: CCI (170)
Wait for the CCI 170 to cross the 0 Line showing an uptrend. It must be the first indicator to cross.
Indicator: CCI (34)
Wait for the CCI 34 to cross above the 0 line, also showing an uptrend. This must be the  second indicator to cross in the same direction as the CCI 170
Indicator: RSI
Price must be above the 14 Moving average

Trade Short: (opposite to the above)
Indicator: CCI 170
Wait for the commodity Channel Index (CCI) 170 to cross below 0 line, showing a down trend, and again t must be the first indicator to cross.
Indicator: CCI 34
Wait for the commodity Channel Index (CCI) 34 to cross below 0 line, showing a down trend, and again t must be the second indicator to cross.
Price must be below the 14 Moving average

Settings:
CCI 170 PERIOD 170
CCI 34 PERIOD 34
Moving Average 14

Important: This system relies heavily on support resistance, Fibonacci levels and pivot points. so if you are near near a support and resistance line, wait to see what the price reaction will be. Wait to see if prices break the support and resistance or bounce off these levels. Always follow the trend and look to buy and tops and bottoms.

Forex Spread Betting Examples of the CCI -1 Min Scalping System applied to the EURUSD:

CCI -1 Min Scalping System

In the spread betting example, you can see I only took the longs trades as only in the long signals did the Commodity Channel Index 170 cross above the 0 line before the Commodity Channel Index 34


I Thank Canadian Dude for inspiring this Forex Spread Betting Strategy.
Back to

FTSE 100 price action scalping

Time frame: 5 Min / 1 min

FTSE 100

Indicators used / Settings: none  / Price Action

********************************

Entry Rules:

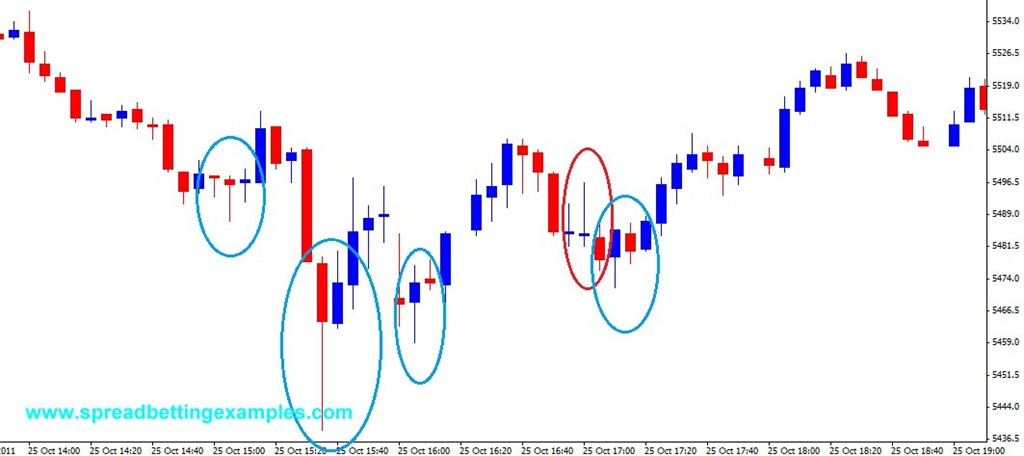
This is a very simple strategy that uses no indicators only price action based on candlestick patterns. I use this scalping strategy on the FTSE 100 trading. It requires a lot of patience but is a very effective trading strategy.  Wait for  shooting star or a hammer to form then enter on the open of the next bar.

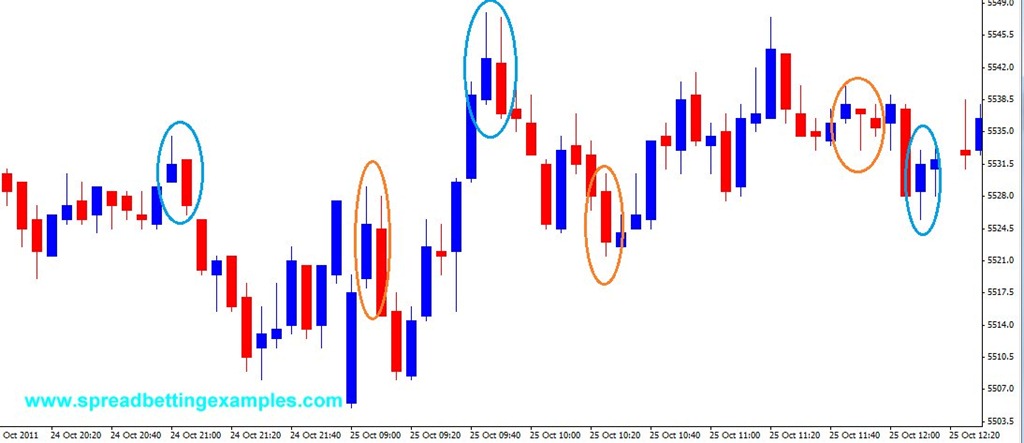
In the Pictures below the blue circles indicate YES TRADE . The red circles are NO TRADE.


Spreadbetting long:

Spread bet long when a hammer forms near the current lows. In the first example you can see this spread betting scalping strategy applied in the first and second blue circles.

Do not trade when the hammer forms while the prices are moving higher. The example in the second picture below, the third red circle is a failed hammer as it occurs within an up trend.

Spread-betting short:

When to short the FTSE100? when a shooting star forms near the current highs. The signal is stronger if the shooting star forms at a resistance level. Furthermore the longer the shadow, the stronger the signal. In the second spreadbetting example below(pic2), the body of the shooting star is relatively small to it’s shadow(first and third blue circle) – this is a strong signal and one to trade. The second circle (red) you can see the shadow is not that long compared to the  body. This is a riskier trade, and don’t suggest to take.

Exit Rules:

This is a Spread betting scalping strategy, so to take 5 max 10 points out of the market.  Your stoploss above / below the low or high of the shadow.

When it works best?

After a rally or a decline and approaching support or resistance

Here is a spread betting example of this FTSE 100 price action scalping strategy

Spread betting example 1

FTSE 100 price action scalping


Spread betting example 2

FTSE 100 price action scalping2

Return to spread betting scalping systems

SpreadTrading the Momentum Indicator

Trading with the momentum Indicator:


 Trend Following

Some like trading with the strength in the Spreadbetting markets and take a long or short position once the Momentum indicator crosses the 50 line. The momentum indicator can be used in both scalping and swing trading. In scalping it would indicate in which direction to spread trade.

Long trade: when the momentum indicator crosses the an absolute value, (often the 50) line to the upside

Short trade: when the momentum line crosses to the downside.

Closing your trade. The momentum indicator is not a good indicator to use to close our trade, because by the time it crosses the 50 line again, most of our profits have been eaten away. You should apply always your money management rules, and look for the when the moment indicator is turning, this would be


Divergence Trading

The momentum indicator is a strong divergence indicator, as prices diminish on their uptrend or down trend velocity the momentum indicator will start turning, thus forming divergence. This is an important concept in technical analysis, the velocity of the price  movement is a leading indicator in a change of trend.


Bullish Divergence can indicate the end of a down trend.


Previous Page:The Momentum Indicator


RSI (Relative Stregnth Index)

#3) RSI (Relative Stregnth Index)

Charts used:FTSE  , Cac30 , Barclays , S&P
Tag: Scalping, Day Trading, Swing Trading
Indicator: RSI – Relative Strength Index
Time frame: Any.

No trading system can rely only on the RSI indicator, but should be used in combination with other indicators or price action. The RSI can give you an edge in your spread betting technique. Before attempting this strategy, read The RSI: The Relative strength article.

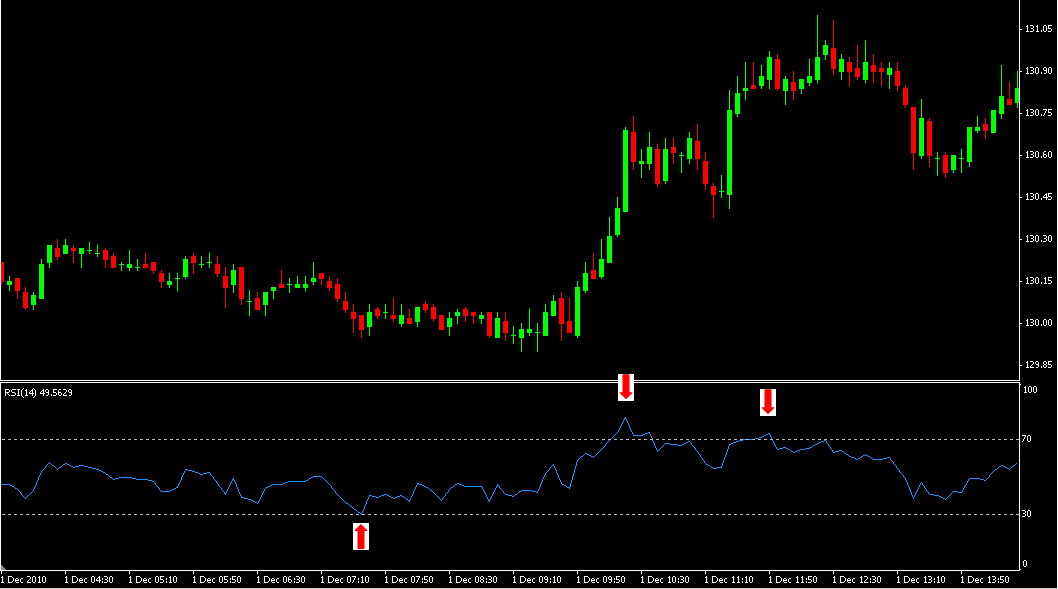
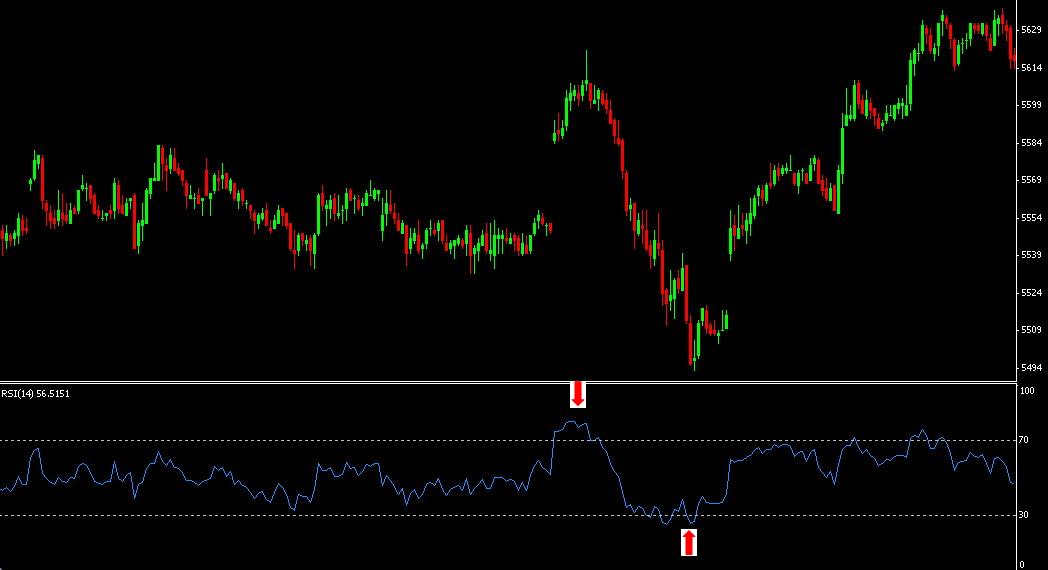
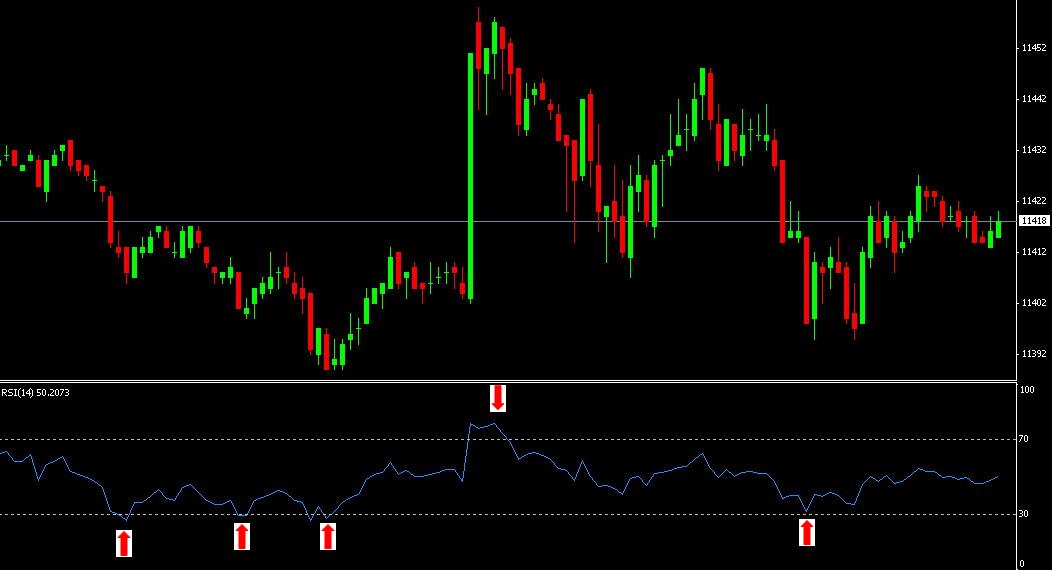
We set the RSI at a period of 14 and monitor the levels 70 and 30.(The RSI is an Oscillator and above 70 indicates that the prices are overbought, below 30 indicates that the prices are oversold).

Entry rules: Buy when the RSI crosses below 30, forms or has formed a bottom, and then crossed back up through 30.
Sell when RSI has crossed above 70, formed a peak, and then crossed back down through 70.

Exit rules: not set. Or use your money management

Advantages: RSI is a very good indicator to refer for confirmation when you are ready to enter a trade in any simple or complex trading system. Best used when trying to trade in a contratrend or or range trading market. In a trending market the RSI, can give false signals.

Disadvantages: You need to monitor your trade, as the RSI alone can give false signals when the market is trending. The RSI Oscillator should be used in combination with other indicators.

Financial Spreadbetting techniques and Tips on how to use the RSI:

Welcome to Spread betting examples

Welcome to spread betting examples this site is meant for those spreadbetting traders that have some knowledge of what financial spread betting is, to help generate other trading ideas.

If you are new to spread betting don’t worry, we will also link or give full explanations of how to spread bet and of  what various technical analysis  terms mean.

We put together our trading knowledge  and other people’s knowledge into this site.

You will find here also the abc of trading, with many different trading styles like, Scalping,   Day trading,   Swing Trading,   Long term trading.  The website is also rich of examples in Financial spread betting  Indices,    Shares Commodities,   Oil,    Gold,   FTSE,   Dow,   Dax, forex, EUR/USD,   Gbp/usd and much more.

I hope you enjoy the tips and ideas, feel free to share your strategies too.

SB