Price Action- Three Black Crows

Price Action- Three Black Crows

This is a very simple setup. No indicators needed just simple price action. You do need to know your candlestick patterns. I will give you all the patterns you need to know and their explanations. This spread betting strategy is applied to BARCLAYS spreadbetting  shares , but it is a pattern you can also apply to Forex spread betting, commodities, Indices.

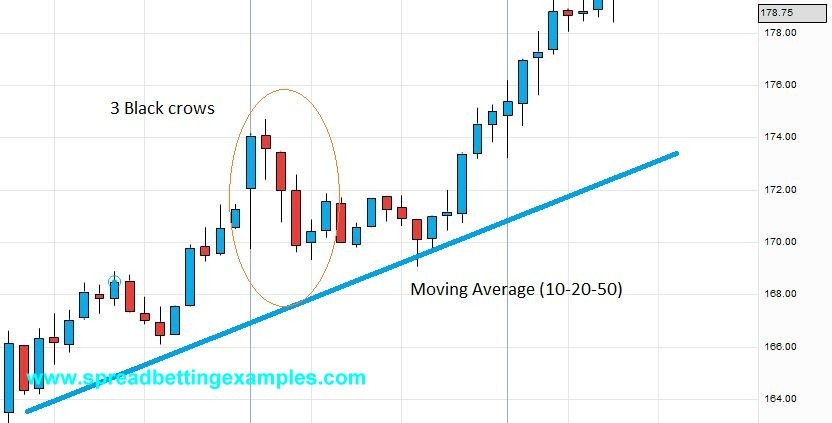
The main setup is to look for prices moving higher in a minor or major price trend. When the retracement occurs and the retracement is a 3 black crow candlestick pattern that stalls on the Moving Average (10 – 20 – 50) this is a good indicator to buy the shares. See the spreadbetting example below:
 

Price Action- Three  Black crows-Barclays_c

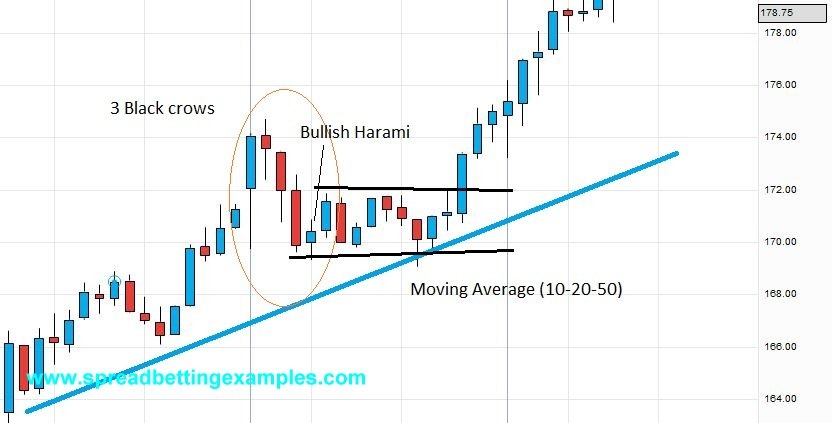
The buy signal after the 3 black crow candlesticks is stronger if followed by a bullish pattern like the bullish harami pattern:
Price Action- Three  Black crows-Barclays_e

The down trend stalls, runs into a sideways movement then followed by a breakout.

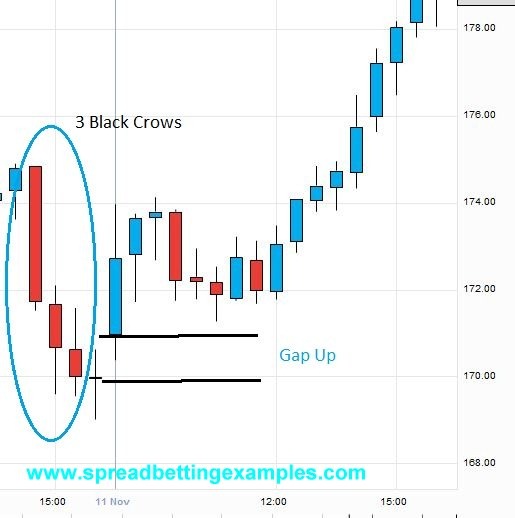
here is another of the three 3 black crow candlesticks followed by a Gap up pattern. If the Gap up window is not closed this becomes a support and short term bullish pattern.
Price Action- Three  Black crows-gap-Barclays_b


A variation of this spread betting system, is to look for the three black crows on the daily chart. If the forth day does not fall further and a sideways trend occurs on a 15 min time frame.  In the bigger picture you will see three black crows followed by a Bullish Harami. On the 5th day look for a break out from the previous day’s range to the up side.
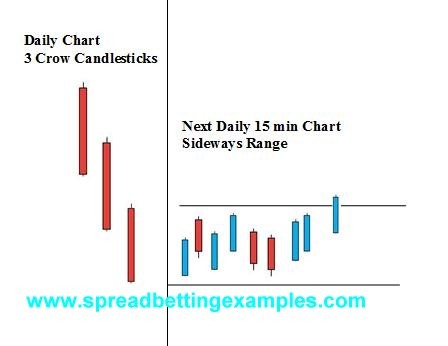
Price Action- Three  Black crows(1)

what does it look like on a daily chart:
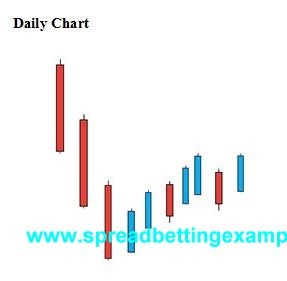
Price Action- Three  Black crows_b(1)


As prices move higher use your money management to move your stoploss higher.

Back to Advanced Spreadbetting systems
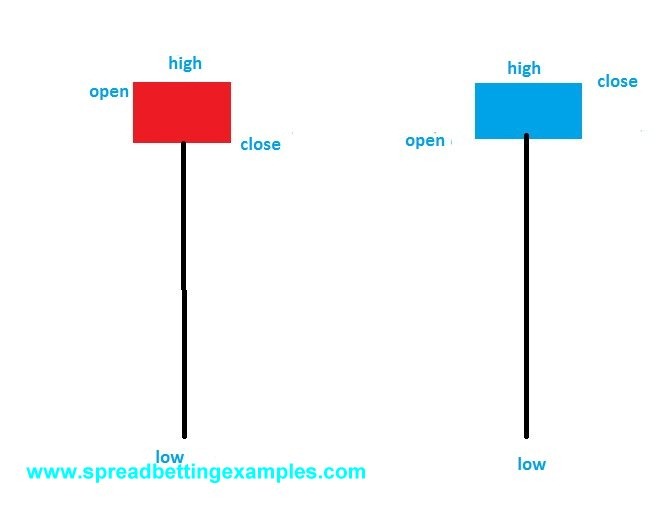
Hammer

Hammer

Bullish Reversal Pattern

What is a hammer?

The is a bullish reversal candlestick. Most bullish reversal patterns this pattern will

-occur within a downtrend or at the bottom of a trend
-Often it is followed by a confirmation candle.

Be aware with bullish reversal candlesticks this is a warning sign of  a possible change in trend, but it is not a signal. Traders normally look for confirmation of a change of trend on the next candle.

Formation:

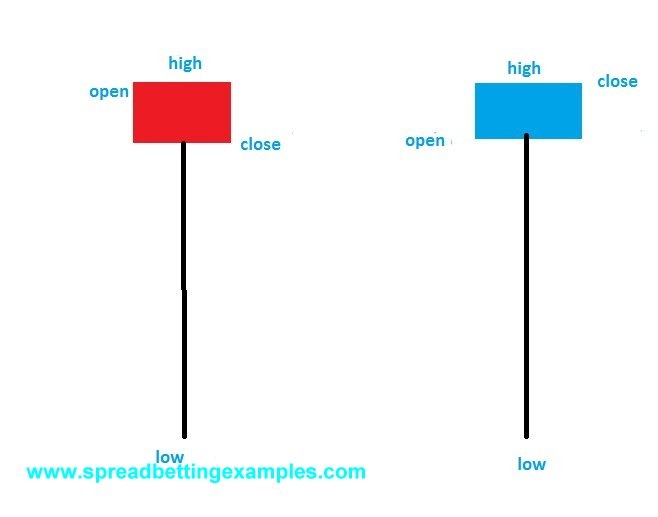
The formation of the hammer , very similar to a hanging man  , this is created when the opening, closing and low prices of the candlestick are in the same area. The hammer will have a long downward shadow. Normally the shadow is 2 to 3 times the size of the body.  The main difference between the hammer and the hanging man is that the hammer occurs at the bottom of the trend and it is a bullish reversal pattern, instead the hanging man occurs at the top of a trend and it is a bearish reversal pattern.

The hammer as the hanging man is created when we get to an oversold area or support point where the bulls are strong. The bulls will stop the prices from moving any lower and push them back up to the opening price. On the next candle the bulls will push the prices higher. This shows a change in strength and the bulls taking control.

The hammer is a strong reversal pattern.

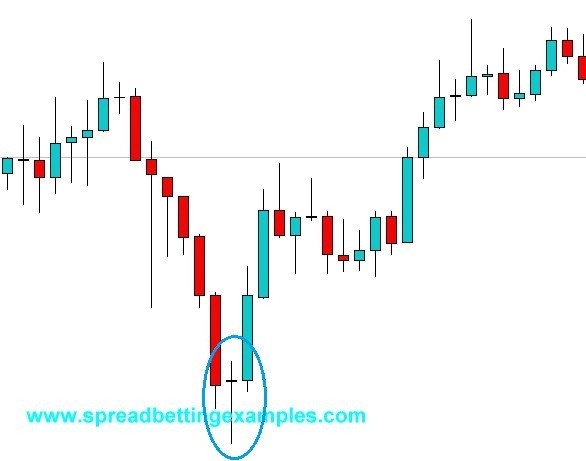
A hammer is often applied to many price action spread betting strategies. Below is a spread betting example of the hammer.

Hammer


How to trade the hammer?

Below is a Forex Spread betting example of the EURUSD.  As you can see prices started falling until the bears met with the bulls that were strong enough to turn around the prices. In a trading strategy the hammer is your warning signal of a change of trend. The candle stick that follows is a strong bullish candle as it closes near it’s highs. On the close of the confirmation candle will conservative traders enter a new trade.


Hammer_EURUSD_2


Back to Spread betting candlestick patterns

Hanging Man

Hanging Man

Bearish Reversal Pattern

The hanging man is a bearish reversal candlestick. Most bearish reversal patterns this pattern will

-occur within an uptrend or at the top of a trend
-Often it is followed by a confirmation candle.

Remember with bullish reversal candlesticks, these are warning sign of  a possible change in trend, but it is not a signal. Traders normally wait for confirmation of a change of trend on the next candle.

Formation:

The formation of the hanging man , very similar to a hammer, this is created when the opening, closing and low prices on a candlestick are in the same area. The hanging man will have a long downward shadow. Normally the shadow is 2 to 3 times the size of the body.  The main difference between the hammer and the hanging man is that the hammer occurs at the bottom of the trend and it is a bullish reversal pattern, instead the hanging man occurs at the top of a trend and it is a bearish reversal pattern.

The hanging man is created because the moment we get to an overbought level or a resistance point where the bears are strong, they stop the prices from moving any higher. On the next candle the bears actually push the prices lower. This shows a change in strength and the bears pushing prices back down.


The hanging man is not as strong reversal pattern as the shooting star.

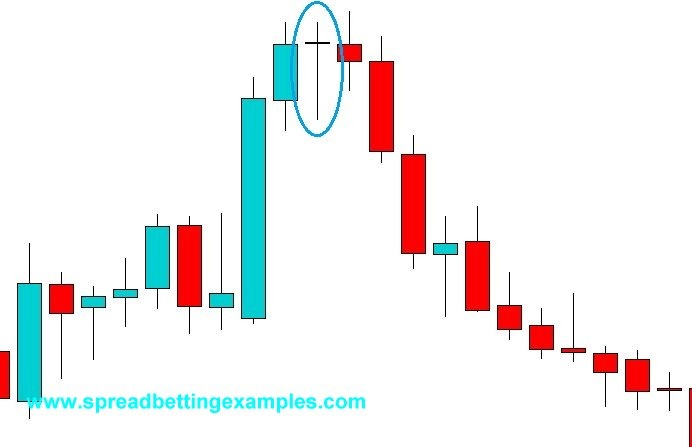
A hanging man is often applied to many price action spread betting strategies. Below is a spread betting example of the hanging man.


Hanging Man


How to trade the hanging man?

Below is a Forex Spreadbetting example of the hammer in GBPUSD. As you can see the bulls were in control, pushing prices higher until they met resistance. In the hammer the bears pushed the prices lower but the bulls were able to give a last push higher, forming the hanging man. On the next candle the bears took control and pushed prices lower.


Hanging Man_GBPUSD_


Back to Spread betting candlestick patterns

FTSE 100 price action scalping

Time frame: 5 Min / 1 min

FTSE 100

Indicators used / Settings: none  / Price Action

********************************

Entry Rules:

This is a very simple strategy that uses no indicators only price action based on candlestick patterns. I use this scalping strategy on the FTSE 100 trading. It requires a lot of patience but is a very effective trading strategy.  Wait for  shooting star or a hammer to form then enter on the open of the next bar.

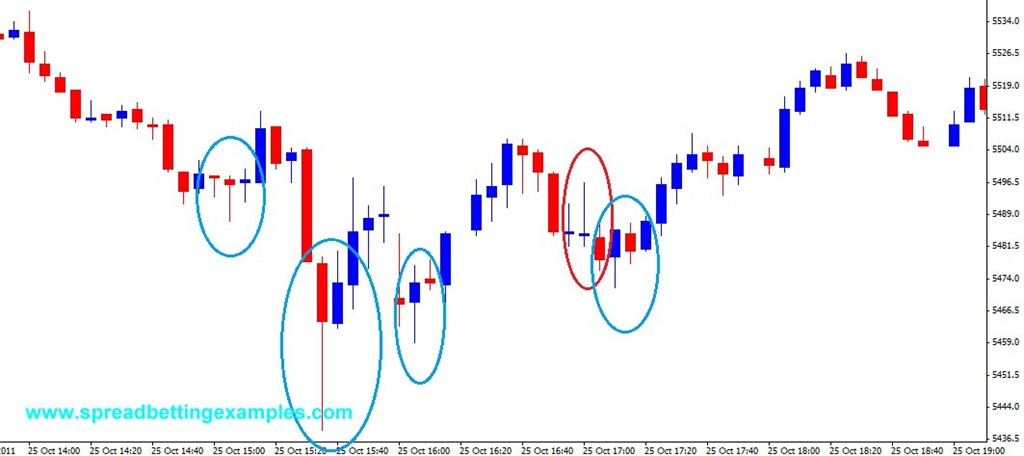
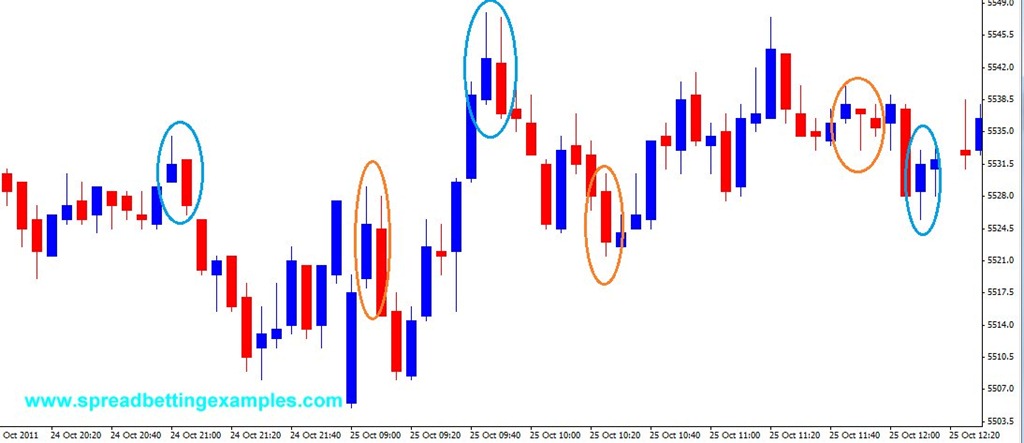
In the Pictures below the blue circles indicate YES TRADE . The red circles are NO TRADE.


Spreadbetting long:

Spread bet long when a hammer forms near the current lows. In the first example you can see this spread betting scalping strategy applied in the first and second blue circles.

Do not trade when the hammer forms while the prices are moving higher. The example in the second picture below, the third red circle is a failed hammer as it occurs within an up trend.

Spread-betting short:

When to short the FTSE100? when a shooting star forms near the current highs. The signal is stronger if the shooting star forms at a resistance level. Furthermore the longer the shadow, the stronger the signal. In the second spreadbetting example below(pic2), the body of the shooting star is relatively small to it’s shadow(first and third blue circle) – this is a strong signal and one to trade. The second circle (red) you can see the shadow is not that long compared to the  body. This is a riskier trade, and don’t suggest to take.

Exit Rules:

This is a Spread betting scalping strategy, so to take 5 max 10 points out of the market.  Your stoploss above / below the low or high of the shadow.

When it works best?

After a rally or a decline and approaching support or resistance

Here is a spread betting example of this FTSE 100 price action scalping strategy

Spread betting example 1

FTSE 100 price action scalping


Spread betting example 2

FTSE 100 price action scalping2

Return to spread betting scalping systems