SPREAD BETTING EXAMPLES – Barclays Shares
I have always been of the opinion that the best way to learn a concept is through examples, and here I present a spread betting example that applied to Barclays PLC that will help your learn how to Spread Bet. So let’s get started.
Let’s say that you believe that Barclays shares were undervalued and that the market has sold them more on a small scare than a real change in company fundamentals. Therefore they have a good chance of rising in the near future. One way of taking advantage of this oversold state, would be to invest money in Barclays and buy the actual company. If your analysis proved to be correct, and the share price did return to their correct value, you would sell your shares at a higher price, making a profit.
An alternative way of taking advantage of your opinion would be to make a spread bet, backing the price to move higher.
Most Spread betting companies have a two-way quote of prices, at which you can ‘buy’ (that is back the price to rise) or ‘sell’ (if you were expecting the price to fall). As it is a bet, all prices you do spread bet on will have an expiry. Normally the expiry co-insides with the expiry of the financial futures date. You cannot hold the spread bet forever, but you can close the bet any time you wish before the expiry date. Similar to conventional trading, you can close your trade at anytime. Later I will expand on the expiry dates, but let’s keep it simple for now. Let’s say that you only want to take a short term bet on Barc.l
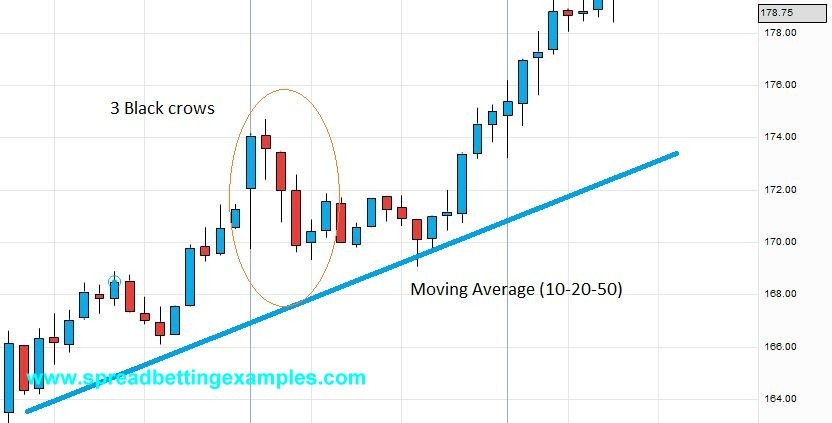
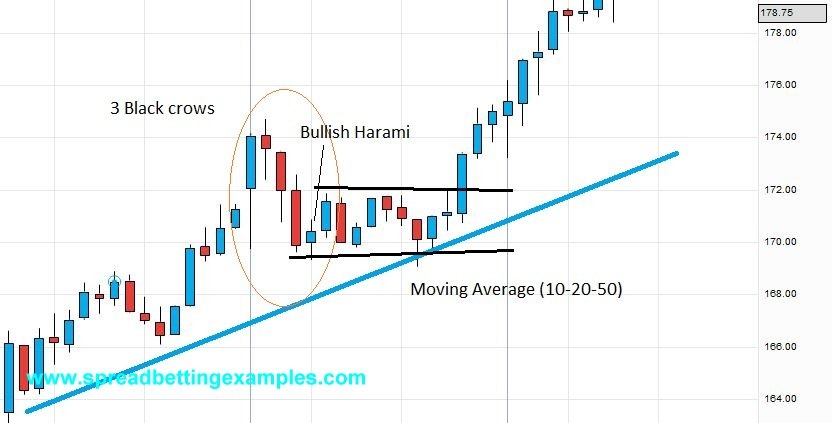
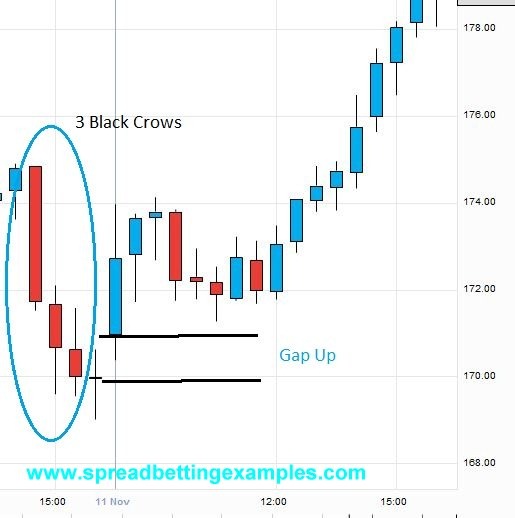
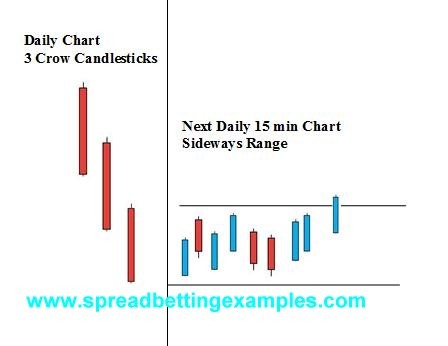
(Below Spread Betting Example of Spread Betting on Barclays Shares)

On our Hourly Chart you see Barclays forming a support area at 170 and you decide to make an up-bet by buying waiting for it to reach 169-170 again and buying higher end of the quote (the difference between the sell and buy price is known as the ‘spread’, by the way, and is where spread betting obtains its name from).
Similar to Share Dealing, the bigger the deal size the more you risk or stand to make or lose money for a given movement in the price. In spread betting you don’t deal in numbers of shares or contracts, spread bets are denominated in a set Pound per Point movement. Let’s say you decide to buy £10 per point. This means that you will make or lose £10 for every point movement the share rises or falls . 184 is equivalent to £1.84 GBP the price of Barclays shares. Therefore one point movement is equivalent to one point movement. Therefore for every penny Barclays moves you will make or lose £10.
Over the next few hours the Barclays share price moves higher reaching 183-184 as you can see the picture in Barclays spread betting example.
You decide to sell your spread bet and take profit. You close your spread bet by ‘selling’ £10 per point at 183 (the lower end of the quote).
Your profit and Loss is calculated by subtracting the price you bought your Barclays share 170 from the price you sold your Barclays share at (183). You closed your bet 13 points higher making a profit of £130 profit.
Back to spread betting examples