Bearish Engulfing Pattern

Bearish Engulfing Pattern

The Bearish Engulfing Candlestick Pattern is a bearish reversal pattern, which usually occurs at the top of an up trend and it consists of a a small bullish candlestick with a small tail followed by a reversal candlestick that overshadows or "engulfs" the small bullish one. The opposite of the Bearish Engulfing pattern is the Bullish Engulfing pattern.

Bearish engulfing pattern

Smaller Bullish Candle (Day 1)

Larger Bearish Candle (Day 2)

So how does this pattern form?

Generally, we find ourselves in an uptrend and a bullish candle forming on Day 1. On Day 2 prices gap upwards but opening higher than Day 1 open.

On Day two the market gapped up, but the bulls fail to push prices higher. Normally this occurs when we approach near a resistance level, where there are many bears awaiting. The strength of the bears and weakness of the bulls pushes Day 2 to close lower than Day 1. In this scenario the body of Day 2 has engulfed Day 1, forming the Bearish Engulfing Pattern.

As stated above, this occurs near resistance point or pivot point, or just a strong change in sentiment in the markets. In fact prices go from a bullish gap up at the open, to the big red bearish real body candle that closes lower than the previous day’s close. Bears have successfully overpowered the bulls on the day and the sentiment is likely to continue for the few periods.


Bearish engulfing pattern_African Barr Gold

A spread betting example of a Bearish Engulfing Pattern and how to apply it in a strategy

Here is a chart below of African Barr Gold, that illustrates a Bearish Engulfing Pattern at the top of an uptrend. The question is when to sell.

1) Sell near the close of Day2. As it comes close to the end of the day, and the prices are closing lower than the previous day’s close. This is a negative sign, the more aggressive traders will sell near the close so they try to anticipate a downward move the following day(3).  Ideally this pattern is accompanied by volume confirmation.

2) Sell on the open of Day 3.  These are traders that wait for the complete pattern to form. End of day traders. Once they recognize the pattern they sell on the Day 3 open.

3) Wait for further confirmation to sell. Here are the more cautious traders that look for further confirmation. or look for a good entry point to sell, maybe a little bounce back up to a resistance point, then they sell. As it happened in day 3 and day 6.

The Bearish Engulfing Pattern is one of the strongest candlestick reversal patterns. The opposite pattern is the Bullish Engulfing Pattern.

Back To

Hanging Man

Hanging Man

Bearish Reversal Pattern

The hanging man is a bearish reversal candlestick. Most bearish reversal patterns this pattern will

-occur within an uptrend or at the top of a trend
-Often it is followed by a confirmation candle.

Remember with bullish reversal candlesticks, these are warning sign of  a possible change in trend, but it is not a signal. Traders normally wait for confirmation of a change of trend on the next candle.

Formation:

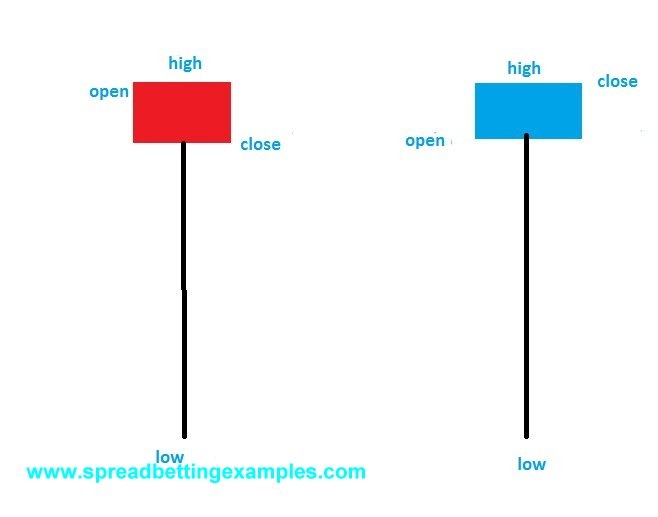
The formation of the hanging man , very similar to a hammer, this is created when the opening, closing and low prices on a candlestick are in the same area. The hanging man will have a long downward shadow. Normally the shadow is 2 to 3 times the size of the body.  The main difference between the hammer and the hanging man is that the hammer occurs at the bottom of the trend and it is a bullish reversal pattern, instead the hanging man occurs at the top of a trend and it is a bearish reversal pattern.

The hanging man is created because the moment we get to an overbought level or a resistance point where the bears are strong, they stop the prices from moving any higher. On the next candle the bears actually push the prices lower. This shows a change in strength and the bears pushing prices back down.


The hanging man is not as strong reversal pattern as the shooting star.

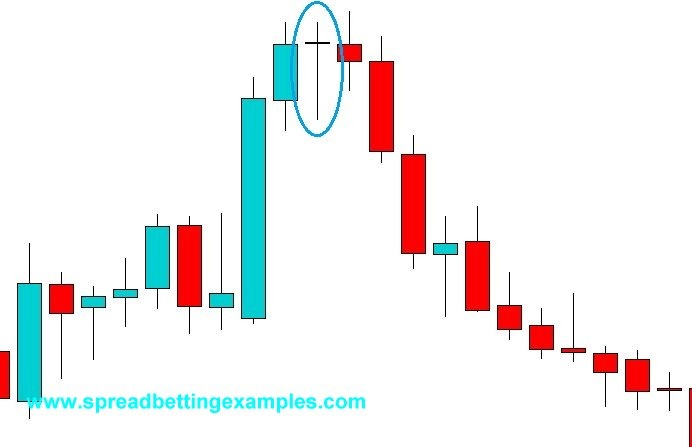
A hanging man is often applied to many price action spread betting strategies. Below is a spread betting example of the hanging man.


Hanging Man


How to trade the hanging man?

Below is a Forex Spreadbetting example of the hammer in GBPUSD. As you can see the bulls were in control, pushing prices higher until they met resistance. In the hammer the bears pushed the prices lower but the bulls were able to give a last push higher, forming the hanging man. On the next candle the bears took control and pushed prices lower.


Hanging Man_GBPUSD_


Back to Spread betting candlestick patterns

Shooting Star

Shooting Star

Bearish Reversal Pattern

What is a Shooting Star?

The shooting star is a bearish reversal candlestick. Most bearish reversal patterns this pattern will

-occur within an uptrend or at the top of a trend
-Often it is followed by a confirmation candle.

Be aware with bullish reversal candlesticks this is a warning sign of  a possible change in trend, but it is not a signal. Traders normally look for confirmation of a change of trend on the next candle.

Formation:

A shooting star is created when the opening, closing and low prices on a candlestick are in the same area. The shooting star will have a long upward shadow. Normally the shadow is 2 to 3 times the size of the body.  The whole theory behind this is that prices have been moving higher until they reach a high point or a resistance. They try move higher but the sellers come in and push the prices all the way back down to the opening price. This shows the strength in the sellers.

A strong pattern shooting star is formed when the closing price is in line with the opening price or is lower than the opening price.

Shooting stars are often applied in many price action spread betting strategies. Below is a spread betting example of the shooting star.

Shooting star


Here is an example of the shooting star applied in a scalping spread betting strategy on the FTSE.


How to trade the shooting star?

Below is a of a shooting star in GSK.L

GSK Shooting

As you can see in this strategy the prices were moving in an uptrend, until prices reached a new high. At this high, a lot of selling pressure comes into the market that pushes the prices way below the opening price of the candle. The next day is dominated by sellers again that the prices close near their lows on a very strong bearish candle. The Bulls try another attempt but are unable to push higher the following day. The shooting star is the first candle that marks a change in trend.

Back to