FTSE100 BB Scalping strategy

Scalping Strategy–FTSE100  5 min Bollinger Bands scalping

Here is a very simple strategy but you do need to familiarize yourself with this strategy before you start using this strategy. It can be effective as it can stop you out quiet frequently. You can trade this on the FTSE100 on a 1min, 5min, 15 min time frame.

Do Not trade this ahead of important data or news.  Do Not Trade when there is a lot of strong bad news or good news in the market as the FTSE100 is likely to take a direction. Best to trade it after the FTSE open and before the 13.30 economic data or US open.  Unless the economic data that is coming out has no importance.

Settings:
Bollinger Bands 50 period, 2 Standard deviation (magenta)
Bollinger Bands 50 period, 3 Standard deviation (blue)
Bollinger Bands 50 period, 4 Standard deviation (orange
)

Spread betting Rules:
Go Long
when the price crosses the first Bollinger Band (magenta) to the downside, moving towards the second Bollinger bands (Blue), when it fails to reach the blue band and moves back up, this is when you go long, with your stop loss below the low the candle.
If, instead, the prices cross the blue Bollinger band moving lower towards the orange Bollinger band but fail to break the orange band and moves back up towards the centre of the bands, again this is where you buy and go long with stoploss below the low of the candle. Remember, this time while the prices were moving lower they must not have stalled between the magenta and blue. If you get stopped out, just wait for the next signal.

Go short when the opposite happens.
Scenario A. Prices move higher breaking the magenta bollinger band but failing to reach the blue bollinger band. It moves back towards the centre of the bands, go short with stoploss just above the band.
Scenario B. Prices moves past the magenta and blue bands to then stall between blue and orange. At this point, as prices move back into the bands, tanke a short trade with stio above the spike candle.

In both scenarios, being patient and waiting for the correct setup, is the key to trading.

Ideal scenario: when the markets are trading sideways, or the market is quiet with news to come out in a few days and prices are mainly moving sideways with occasional runs up or down.

What to be careful with this is when there is very strong news and the FTSE100 takes a direction. This is a mean reversal strategy, and we don’t want the FTSE100 to move in one direction.


Below is a when the strategy works really well. Prices break the first bollinger band then retraces.
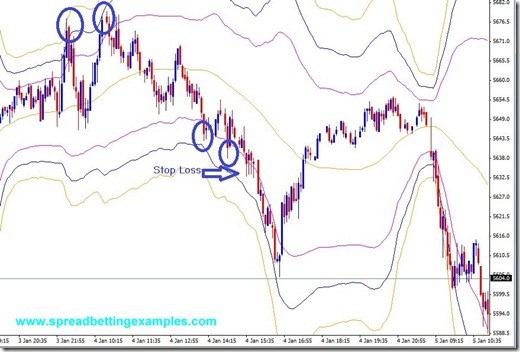


This is a second example of this . Here we get stopped out as soon as prices move in a trend. As you can see from the time, it is after 13.30. There was economic data that made the markets take a trend.
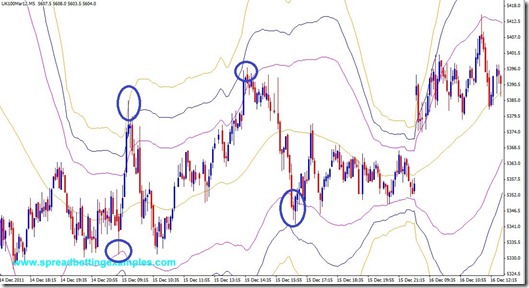
Any queries, post a comment and I will be happy to answer

Back to

Scalping Strategy – The Spike Scalping System

Scalping Strategy – The Spike Scalping System

This is a very simple scalping strategy, but at the same time does require quiet a bit of trading experience. It is scalping spikes. This strategy falls also under Price Action as there are no indicators’ involved. In this strategy Money management Rules are important, and this is the reason why many experienced traders with a strong understanding of support and resistance should trade this strategy. The Spike scalping strategy is a system that looks at pervious resistance and support areas, and waits for price to move back to these areas. Once prices reach the previous support or resistance, wait for the current candlestick to form a long spike but return to it’s starting point. Once the candle closes you can scalp 6-15 points in the opposite directions of the spike, with your stoploss above or below the spike. The Body of the candle must be smaller than the spike.

Here is a to show this strategy:

Scalping Strategy - The Spike Scalping System

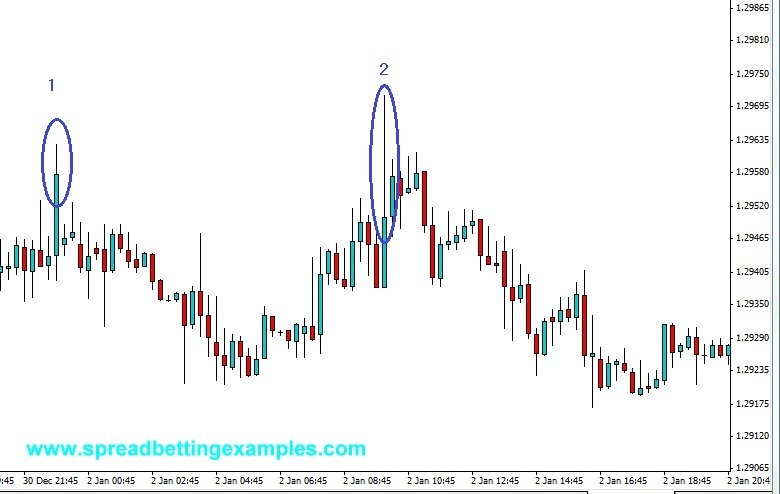
In this Scalping Strategy there was a previous resistance point at #1. This was a strong resistance. A Spread Better will wait for prices to test this level again.  In fact at point 2 prices re-test the previous resistance but fail to break this level. Your entry would be at the close of the candle with your stoploss above the high of the candlestick with the large spike.  In this case the spike was 25 points you would look for a 10 to 15 point profit. For those that would like to run their trades, they could do this, no longer being this a scalping strategy. The above scalping strategy is shown on a 15 min chart, to avoid Noise or fake support and resistances. In the case above, a spread better would look to enter a scalping strategy short.

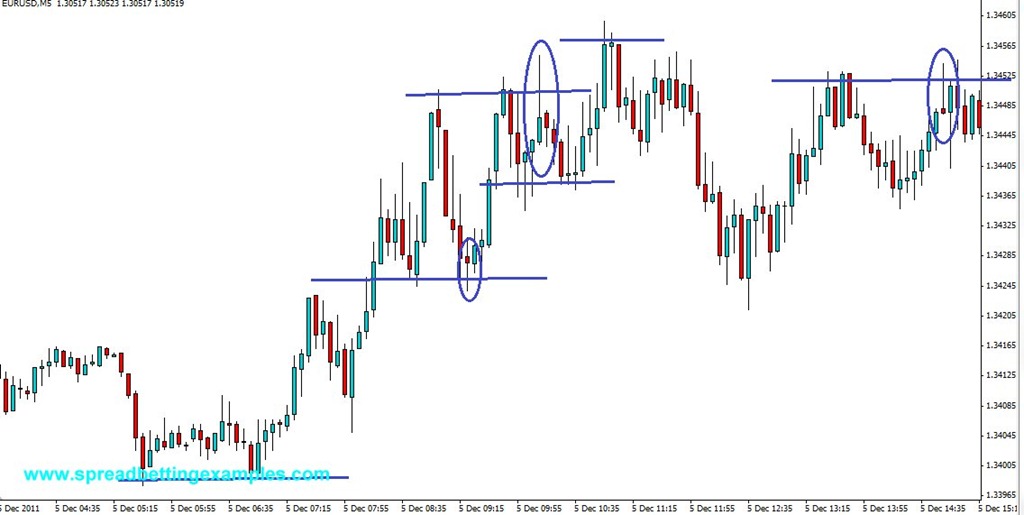
Below is a scalping strategy on a 5 minute chart. As you can see only when there has been a previous resistance or support level and the following candle that tests this level forms a big spike we enter a spread betting trade long or short. Looking to make 10-15 point out of the market.

As you can see from the spread betting example below, the circled candles have small bodies, big spikes in correspondence with previous support and resistance levels.


Scalping Strategy - The Spike Scalping System_5min


Back to

CCI -1 Min Scalping System

CCI -1 Min Scalping System

This is Forex spread betting scalping strategy, I have used it on an MT4 but can also be applied to other charts
Trade From 8am UK time to 16 UK Time

Time Frame: 1 min

Forex Spread Betting Rules:

Trade Long:
Indicator: CCI (170)
Wait for the CCI 170 to cross the 0 Line showing an uptrend. It must be the first indicator to cross.
Indicator: CCI (34)
Wait for the CCI 34 to cross above the 0 line, also showing an uptrend. This must be the  second indicator to cross in the same direction as the CCI 170
Indicator: RSI
Price must be above the 14 Moving average

Trade Short: (opposite to the above)
Indicator: CCI 170
Wait for the commodity Channel Index (CCI) 170 to cross below 0 line, showing a down trend, and again t must be the first indicator to cross.
Indicator: CCI 34
Wait for the commodity Channel Index (CCI) 34 to cross below 0 line, showing a down trend, and again t must be the second indicator to cross.
Price must be below the 14 Moving average

Settings:
CCI 170 PERIOD 170
CCI 34 PERIOD 34
Moving Average 14

Important: This system relies heavily on support resistance, Fibonacci levels and pivot points. so if you are near near a support and resistance line, wait to see what the price reaction will be. Wait to see if prices break the support and resistance or bounce off these levels. Always follow the trend and look to buy and tops and bottoms.

Forex Spread Betting Examples of the CCI -1 Min Scalping System applied to the EURUSD:

CCI -1 Min Scalping System

In the spread betting example, you can see I only took the longs trades as only in the long signals did the Commodity Channel Index 170 cross above the 0 line before the Commodity Channel Index 34


I Thank Canadian Dude for inspiring this Forex Spread Betting Strategy.

Back to