Gold Pivot Point Strategy
Pivot points are a very old way of calculating support and resistance points in a chart. The calculations is very simple as it was widely used in the commodity pits and these calculations were done mentally while traders were deciding to or not take trades.
This is the Pivot point Formula: P = (H + L + C) / 3. (P= Pivot Point, H = High L = Low). Then you have your resistance R1 = P + (P − L) = 2×P − L and Support S1 = P − (H − P) = 2×P − H levels. To learn more about pivot points you can read further in the technical analysis section: Pivot Points.
Getting back to the strategy. As we said this is a strategy to adopt not when you expect very strong news but on quiet or normal (Non news rich) days, or at least adopt with caution. During high volatility is when this strategy can stop you out.
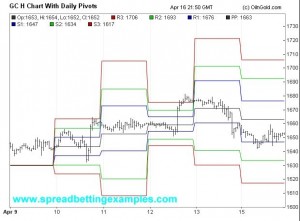
As you can see from the graph above, there are various support and resistance levels. Normally you have R1, R2, R3 and S1, S2, S3. The further out the support and resistance the less likely you will be filled. But you can trade the various support and resistance levels according to the volatility.
I prefer to trader S2 and R2 and I have less risk tolerance and more patience. If you trade R1 and S2 you will get more trades and be stopped out more often, and on the other hand, S3 and R3 you might not get a trade.
Well let me explain How to trade this Gold Pivot Point strategy. This is a mean reversion strategy, that means you place your order to buy and sell on the support and resistance levels and when your order is filled you want the price to return to the pivot, or the middle. The pivot is also considered the average level. At this point is where you close out your trade, and take profit. A Practical Example 1. You believe that the trend is going up, so Ideally you would place your order to buy on the support 2 level(the green line), with your stoploss just below S3. You wait for an unexpected change in trend (temporary in nature) to drop to the support then bounce off this level and move back up in the direction of the trend. Once it reaches the pivot you take profit.
A Practical Example 2. Another example would be, you believe that the trend is moving up, and News has just come out that has pushed the trend further up. You believe that R3 is far over done and therefore your decide to place your order to sell at at R3, looking to take profit on the retracement down to R2 level. This is a riskier trade as you are going against the trend, but it is important that you manage your risk.
Another tip on pivot point trading: If the support and resistance levels coincide with another strong technical indicator, example a 50 day moving average, this level become even stronger.
Now these are very simple strategies to execute what you got to know or have the feel is of the actual Gold market and the fundamental news that is coming out that day.
if you have any questions email me, or if you believe I have left something out. Click here to return to the main menu simple spread betting strategies or if you you want to go back to Gold trading strategies
