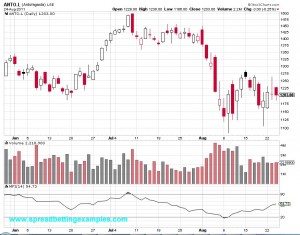
Indicator: Money Flow Index
Family: Oscillator
Money Flow index is a momentum oscillator based of the change of price and volume. This is based on a similar concept to the Accumulation and Distribution, normalized between 1 – 100 , to create an oscillator similar to the RSI and interpreted in the same way. As an oscillator closely linked to volume it is best used to identify reversals and price extremes.
Calculations:
- Typical Price: (High + Low + Close) / 3
- Money Flow: Typical Price x Volume
- Positive Money Flow: The Money Flow on days where the Typical Price is greater than the previous day’s Typical Price.
- Negative Money Flow: The Money Flow on days where the Typical Price is less than the previous day’s Typical Price.
- Money Ratio: Positive Money Flow / Negative Money Flow
- Money Flow Index: 100 – [100 / (1 + Money Ratio)]
Example of the Money Flow Index:
Trading with the Money Flow Index:
Not many spread betting platform charts offer the Money flow index, but if you are using a private charting package that has volume indicated. You can spread bet referring to these charts
The Money flow index used as a confirmation tool:
- MFI < 20 – oversold
- MFI > 80 – overbought
As an Oscillator bound between 0-100, a reading between 0 – 20 indicates that the indicator is oversold and a reading between 80 – 100 means the indicator is overbought.
When the indicator finds itself in the oversold region, traders should look to start covering their shorts.
When the indicator is in the overbought region, traders should start covering their long positions.
Next Page:The Money flow index used as a warning signal tool
