Forex Spread Betting Example
Many have been reading about the Euro, and how, maybe, it might not exist anymore in 3 – 5 Years time. The Euro moved steadily from 2005 where it was trading at 1.1700 against the USD 1.600 just before the financial crisis. In little over three month the eurusd moved from 1.6000 to 1.2314. This is a 23% movement from the beginning of August 2008 to the end of October 2008. From 2008 until today, the Euro recovered faster than the USD as there was a general scare in the US debt, but then the debt fear spread into Europe, with Greece. The Euro in all this moved twice up and down between 1.500 and 1.2400.
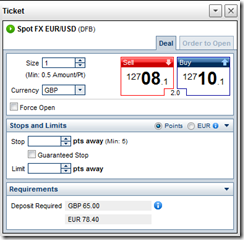
Many Spreadbetters are taking advantage of these moves, so lets look at a Forex spread betting example to show you how to trade the EURUSD and what kind of risk there might be. Let’s start off by looking ate the quote. The EURUSD is quoted as 12706.1/12708.1.
The smallest unit we are trading or spread betting on, is the 06/08. For every point these move we are risking our stake. In other words if we placed £1 in the stake box as in the spread betting examples below, we are risking £1 per every point movement.
As you can see from the screen shot above of an IG Index platform, we will need a deposit of £65 to open this trade without a stoploss. If we place a stoploss, this margin requirement would decrease.
If Eurusd we decided to buy £2 a point at 12708.1 and the Eurusd moved to 12789/12791 we would have made 80.9 (12789 – 12708.1) points * £2, that is a profit of 161.81. If instead of moving higher the EURUSD moved lower we would have lost £2 a point for every point movement lower, until it reaches your stoploss. Remember to monitor your risk with Stoplosses.
The question is How do I know what stake I need to put for the EURUSD? You can do this by calculating the average range. If you do this you will see that the Eur moves on average 80 to 120 points in a day. That is nice movements for scalpers.
Back to spread betting examples

