Basic strategy using the Aroon Indicator
Many have emailed me and asked what was the Aroon Indicator in their IGIndex accounts, here is a simple explanation of the Aroon indicator and presented in a simple strategy.
The main function of the Aroon indicator is used to know when the market is in an upward or downward trend, or simply ranging. It is helpful to also define which strategy is right for the current market conditions. Simply put, many strategies loose money in non-trending conditions, thus knowing (or at least having an indicator that informs you) when the market is trending or not can save many spread betters a lot of money.
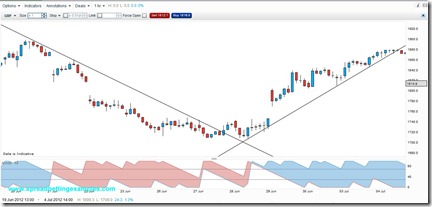
Below is a spread betting chart of BHP Billiton, using the Aroon Indicator. This is an hourly chart taken over the last two weeks. In the chart I show how the Aroon Indicator was able to capture one full week of downtrend and one full week of uptrend:
How to Interpret the Aroon Indicator
If you look closely to the Aroon Indicator you will see that it is made up of a red line and a blue line. On the chart you will notice also the 70 and 30 horizontal line. When the Red line is above the 70 line and the blue line is below the 30 line, this indicates that the markets are in a downward trend.
Instead when the Aroon Up Indicator, the blue line, is above the 70 line and the Aroon down Indicator, the red line, is below the 30 line then the market is trending Upwards.
When both the Aroon Indicators are in the centre of the trading chart then this means the market is consolidating.
The default setting of the Aroon Indicator in your spread betting account is 14 periods. This means it is 14 bars of the time frame you are looking at. f you increase the Time frame to 25, which is the By varying the period length, the Aroon indicator can give long term indications of trend or short-term indications of trend. By default, the Aroon indicator is 25-periods, the more you increase the periods the longer trends you will spot.
But pay attention: the longer the time frame, the less sensitive it is to a changing trend.
On the other hand if you decrease the time frame it will react quicker to changing trends but it could miss out on long trends, showing you more trades and changes of direction.
The Aroon indicator measures how many periods since the price recorded a x-period high or low. The Aroon-Up and Aroon-Down are two separate indicators and measure: (As per the 14 period setting in your IG account) Aroon-Up measures the number of days since a 14-day high; and 14-day Aroon-Down measures the number of days since a 14-day low.
The Aroon indicator is unique as it focuses on time relative to price, unlike the typical momentum oscillator.

Comments
One response to “Basic strategy using the Aroon Indicator”
The backtest of the Aroon Indicator: http://www.oxfordstrat.com/trading-strategies/aroon-indicator-crossover/