Trading with the Money Flow Index:
The Money flow index used as a warning signal tool:
The MFI is a good indicator of divergence and convergence as it has volume incorporated in it’s calculations. As volume is said to precede prices, it is a good indicator of when prices are turning.
Bearish divergence is when prices are rising but volume is declining, that is: volume is less that other up days.
Bullish divergence is when prices are falling but volume is increasing, that is: volume is greater than in other down days.
Bullish Divergence:
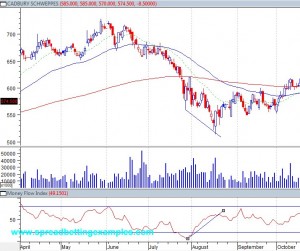
As you can see from the Cadbury Schweppes graph (CBRY.L), prices were making new lows, instead the money flow index was making new highs on the strong volume.
This would have been a good opportunity to spread bet a long position as soon as the bullish engulfing pattern was completed confirming the bullish divergence.
Bearish Divergence:
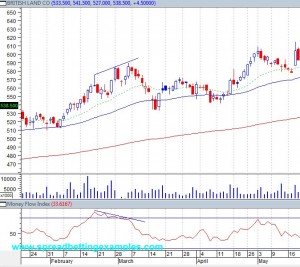
Instead in British Land (BLND.L) we can see the opposite pattern occurring. Prices are making new highs but this is not confirmed by the money flow index that is making lower highs. As you can also see this is replicated in the volume, lower highs.
This alerted spread betters to get ready to short the market. In fact as you can see the sign of weakness is confirmed by the Harami pattern that form after the new highs.
As you can see above the Money Flow Index is an effective price confirmation tool and price reversal warning tool.
Previous Page:The Money flow index used as a warning signal tool

