Spread Betting System–Range Trading

Spread Betting System–Range Trading

This is a very simple spread betting strategy, requires no indicators, but I would say you do need some trading experience before starting out with this strategy. I say this only because more experienced traders know how to deal with the psychology of trading and have an idea when to apply this spread betting system.

Pair: USDCHF
Time: 15/30 min


Wait for the pair to come out of a upward or downward movement. Once the markets have calmed down and you believe there is no major news anymore, and that the pair will start trading sideways. Draw your support and resistance lines and trade the range.


image

Footsie 100 RSI–Stochastic-SMA

Footsie 100 RSI–Stochastic-Simple Moving Average

This is a simple spread betting strategy, it is made up of three indicators. More indicators you apply to a strategy more you filter the buy and sell signals.  When coming across a new strategy it is always best to make the strategy yours.  When I say make the strategy yours I mean, know the pros and cons of the individual indicators, back test it a little by looking at historically where it would have made you money and where it would have lost you money. This strategy is also good for those that don’t have much access to your trading screen during the day. Now lets step straight into the strategy.

Trading setup:

Simple Moving Average (100)
RSI (3)
with horizontal lines at 70 and 30,
Full Stochastic (5, 3, 3) with horizontal lines at 75 and 25
Time Frame Daily Chart


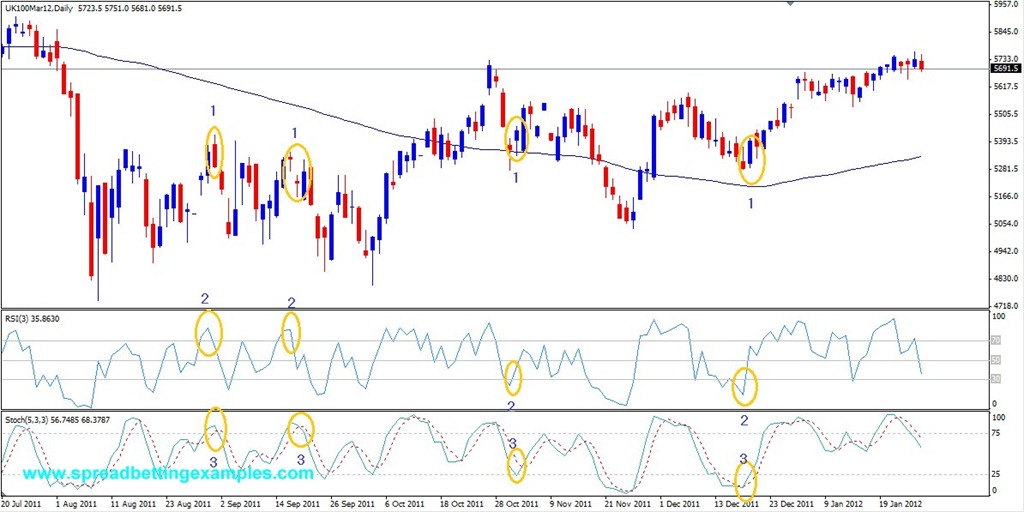
Footsie 100 Spread betting example

Footsie 100 RSI–Stochastic-Simple Moving Average


Trading rules:

The Simple moving average gives you the direction of the trade. If your price is above the simple moving average then you will look for long trades, if instead the price is below the simple moving average you will look for short trade entries.  In this strategy The RSI (relative strength index) has a small time frame therefore it will make sudden shifts as the prices change direction. In this simple strategy the the RSI will give you the signal to buy and sell before the Full stochastic.

Enter a long spread bet, when prices are trading above the 150 simple moving average & you see the RSI  moving up from below the 30 level moving higher. As the RSI has crossed the 30 Line upwards, keep your eyes o the stochastic, and wait for the stochastic to move from below the 25 line crossing upwards. As the stochastic moves above the line, you can enter your long trade. Some will wait for the next candle of the next day to take the trade. They will take the trade as the FTSE opens the next morning, or place an order to buy the UK100.
If at least one of the conditions is not met – stay out.

The Short spread bet is the opposite to the above trade: when the FTSE100 price is trading below the 100 SMA, look for only short entries. Now wait for the RSI move down lower from above the 80 mark to below the 80 line moving to the downside. Now again, wait for the Stochastic lines to cross the 70 line lower, heading south- enter your Short.

The Stop Loss. You should abide to your money management rules, but here are some cases where stop losses could be placed. The stop is placed at the moment of entry and is adjusted to the most recent swing high/low.

Profits taking suggestions:

-when the crosses the opposite line. If you are long. The Stochastic moves up above the 75 line, or if you are short the Stochastic moves up lower the 25 line.
-Or simply, you can have a trailing stoploss.

This strategy has good potential. Make it your own. Do not try to anticipate signals. If there is no signal don’t trade it or force the trade.


Back to Simple Trading Strategies

Bond – German 10 year Bund

of the German Bond

You have got into trading, and and you have a good understanding of Indices and Shares. Forex is maybe too fast for you but you have now a curiosity of trading the Bond Market. A good place to start would be our local European 10 year German Bond. Here I will give you an example of how to trade the German Bund. Further on I will show you the various products you can trade in the bond market, I will also give you a brief explanation on why you would trade the individual products.

The first thing to take in consideration when you want to trade a new market, is know the Margin (deposit), the stake you would like to spread bet and your markets Typical movement.

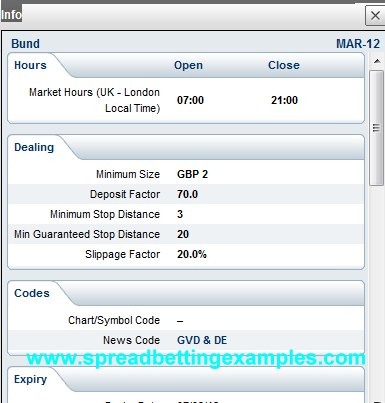
1) The Initial Margin Required: to know the margin, Log into your account and look for the information sign.
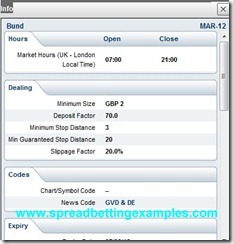
German Bund Spread Betting

As you can  see from the screenshot of this IG account the deposit factor is 70 x your bet. There is a Minimum bet of 2 GBP a point therefore you need a minimum deposit of £140. If you place a stop loss the initial margin is reduced by the distance between your opening price and stoploss, let’s say 25 points,  times your stake. If your bet is £2 you will need a minimum deposit of £50 in this case.

2) You Spread bet stake you would like to place: Let’s say you have a 5, 000 GBP account and you decide you would like to place a maximum 2 % at risk for this trade, that is £100 not more. We will use the example of the 10 year German bond below.
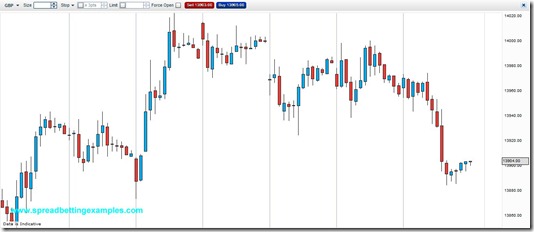
German Bund Spread Betting_2

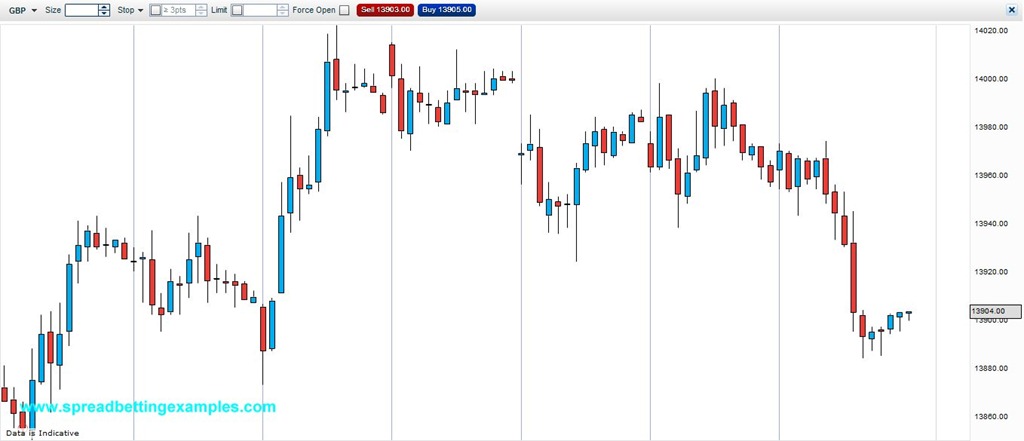
The German Bund is currently trading 13903/ 5. To sell it is the lower price, 13903 and to buy it is the higher price 13905. The difference between the buy and sell price is known as the spread. The spread is your cost of trading. Spread betting companies charge a little commission on top of the market spread. In this scenario the spread is 2 points, which is quiet cheap, given they allow your to leverage your money.

Trading Long Example: So you have a hunch prices have just bounced off a support level or a pivot point and that the German Bund should not trade below 13880. At this level is where you will decide to exit if prices fall below 13880. The German Bund is currently trading at 13905. You also believe it should move back up to 13980, where you are more than happy to take profit. You have decided not to risk more than 2% of your account(£100). Therefore you decide to buy at 13905 and place your stoploss at 13880. This is a distance of 25 points. Therefore £100 / 25 point stoploss  =  £4 point stake.

If the Bund Moves Up to 13980 you have made 75 points (13980 – 13905 = 75) * your £2 you have made £150. If instead the prices fall back below the 13880, you will get stopped out loosing £100 the amount you decided to risk in the first place.

Trading Short Example: Instead if on the other hand you thought this is a little bounce and price will not move higher that 13950 but you believe prices will move down to 13850. Let’s do our maths again. You have decided you only want to risk £100, and the current sell price is 13903, as you feel prices will drop therefore you want to go short.  The distance from the opening price to the stoploss is 48 points, therefore £100 / 48 points = just over £2. For this example we will round off the stake to £2. If prices reach your stoploss you will lose £94, if instead prices reach your target of 13850 you will profit from (13903 – 13850 = ) 53* £2 = £106.


Now that you have had these examples, there is ne more thing to consider, How many points will the bund move today?

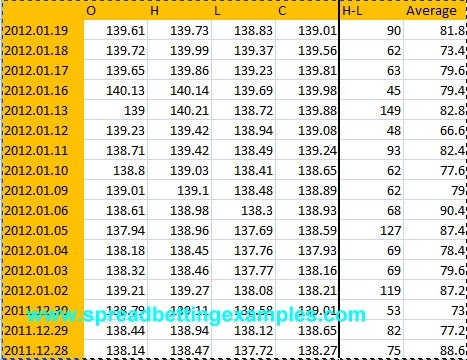
To answer this question I will calculate the average daily movement. I have taken the High – Low and have averaged it out over the last 5 days. loot at the last column. on the 2012-01-19 prices moved 90 points, instead on the other days it moved 60 points. As you can see the average is about 70 – 80 points. this calculation gives you an Idea of what to expect from the German bund market movement in one day.
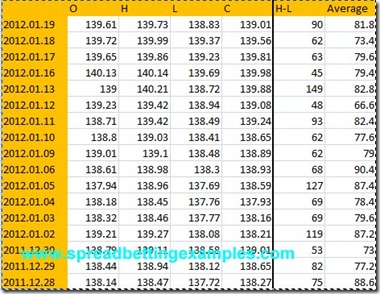
German Bund Average Price


I Hope this spread betting example of the German Bund has been useful. i will later explain what moves the Bond markets and how to trade them.

Back to the spread betting examples

German Bund spread betting

German Bund spread betting

The German Bund is a fixed-interest security issued by the German government to finance its debt. It is used as the benchmark of the European denominated debt. The difference between the German goverment Bund and another European debt, is known as the spread.   Many spread betting companies allow you to spread bet the German bund in both directions for hedging purposes and for speculative purposes.

Bond prices move in the opposite direction of interest rates. Therefore if you expect the EU to cut interest rates you will expect the bond prices to rise. In this case you would place a ‘buy’ trade on the German Bund futures. If instead your expect the interest rates to rise your would sell the Bund futures. Be aware you are spread betting on a long-term interest rate and not on a bank base rates. Generally the longer dated the bond the higher the uncertainty, the more volatile the market can get.

Bond futures are less known in the spread betting arena, but they do offer still plenty of opportunity, especially in uncertain economic times. The markets will seek a flight to safety, creating solid trend within the interest rate financial markets. Example during the collapse of financial markets

Here you can learn a spread betting example of the German bund

Bullish Engulfing Pattern

Bullish Engulfing Pattern

The Bullish Engulfing Candlestick Pattern is a bearish reversal pattern, which usually occurs at the Bottom of a down trend and it consists of a a small bearish candlestick with a small tail followed by a reversal bullish candlestick that overshadows or “engulfs” the small bearish one. The opposite of the Bullish Engulfing pattern is the Bearish Engulfing pattern.

Bullish engulfing pattern

Smaller Bearish Candle (Day 1)

Larger Bullish Candle (Day 2)

So how does this pattern form?

Prices are in a downtrend nearing a support level, and a bearish candle forms on Day 1, which is near or on support level. On Day 2 prices gap downwards, opening lower than Day 1 close.

On Day2 the market gapped downward, but the bears failed to push prices lower, finding lost of buyers in their paths. Normally this occurs when we approach near a support level, where there are many bulls awaiting. The strength of the bulls and weakness of the short sellers pushes Day 2 to close higher than Day 1 open. In this scenario the body of Day 2 has engulfed Day 1, forming the Bullish Engulfing Pattern.

As stated above, this occurs near support levels in a downtrend, on a pivot point in a downtrend, or just given a strong change in sentiment in the markets. In fact prices go from a bearish gap down on the open, to the big blue bullish real body candle that closes higher than the previous day’s open. Bulls have successfully overpowered the bears on the day(2) and this positive sentiment is likely to continue for the next few coming days.


Bearish Engulfing Pattern

Bearish Engulfing Pattern

The Bearish Engulfing Candlestick Pattern is a bearish reversal pattern, which usually occurs at the top of an up trend and it consists of a a small bullish candlestick with a small tail followed by a reversal candlestick that overshadows or "engulfs" the small bullish one. The opposite of the Bearish Engulfing pattern is the Bullish Engulfing pattern.

Bearish engulfing pattern

Smaller Bullish Candle (Day 1)

Larger Bearish Candle (Day 2)

So how does this pattern form?

Generally, we find ourselves in an uptrend and a bullish candle forming on Day 1. On Day 2 prices gap upwards but opening higher than Day 1 open.

On Day two the market gapped up, but the bulls fail to push prices higher. Normally this occurs when we approach near a resistance level, where there are many bears awaiting. The strength of the bears and weakness of the bulls pushes Day 2 to close lower than Day 1. In this scenario the body of Day 2 has engulfed Day 1, forming the Bearish Engulfing Pattern.

As stated above, this occurs near resistance point or pivot point, or just a strong change in sentiment in the markets. In fact prices go from a bullish gap up at the open, to the big red bearish real body candle that closes lower than the previous day’s close. Bears have successfully overpowered the bulls on the day and the sentiment is likely to continue for the few periods.


Bearish engulfing pattern_African Barr Gold

A spread betting example of a Bearish Engulfing Pattern and how to apply it in a strategy

Here is a chart below of African Barr Gold, that illustrates a Bearish Engulfing Pattern at the top of an uptrend. The question is when to sell.

1) Sell near the close of Day2. As it comes close to the end of the day, and the prices are closing lower than the previous day’s close. This is a negative sign, the more aggressive traders will sell near the close so they try to anticipate a downward move the following day(3).  Ideally this pattern is accompanied by volume confirmation.

2) Sell on the open of Day 3.  These are traders that wait for the complete pattern to form. End of day traders. Once they recognize the pattern they sell on the Day 3 open.

3) Wait for further confirmation to sell. Here are the more cautious traders that look for further confirmation. or look for a good entry point to sell, maybe a little bounce back up to a resistance point, then they sell. As it happened in day 3 and day 6.

The Bearish Engulfing Pattern is one of the strongest candlestick reversal patterns. The opposite pattern is the Bullish Engulfing Pattern.

Back To

Forex Spread Betting Example

Many have been reading about the Euro, and how, maybe, it might not exist anymore in 3 – 5 Years time.  The Euro moved steadily from 2005 where it was trading at 1.1700 against the USD  1.600 just before the financial crisis. In little over three month the eurusd moved from 1.6000 to 1.2314. This is a 23% movement from the beginning of August 2008 to the end of October 2008. From 2008 until today,  the Euro recovered faster than the USD as there was a general scare in the US debt, but then the debt fear spread into Europe, with Greece. The Euro in all this moved twice up and down between 1.500 and 1.2400.

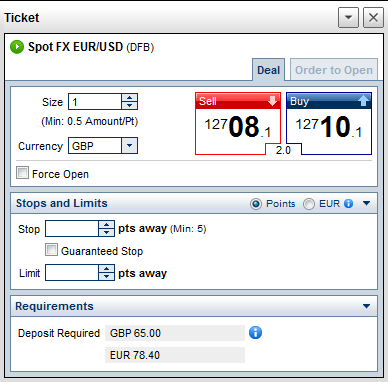
Many Spreadbetters are taking advantage of these moves, so lets look at a Forex spread betting example to show you how to trade the EURUSD and what kind of risk there might be. Let’s start off by looking ate the quote. The EURUSD is quoted as 12706.1/12708.1.

EURUSD Forex Spread betting example

The smallest unit we are trading or spread betting on, is the 06/08. For every point these move we are risking our stake. In other words if we placed £1 in the stake box as in the spread betting examples below, we are risking £1 per every point movement.
EURUSD_stake Forex Spread betting example

As you can see from the screen shot above of an IG Index platform, we will need a deposit of £65 to open this trade without a stoploss. If we place a stoploss, this margin requirement would decrease.

If Eurusd we decided to buy £2 a point at 12708.1 and the Eurusd moved to 12789/12791 we would have made 80.9 (12789 – 12708.1) points * £2, that is a profit of 161.81. If instead of moving higher the EURUSD moved lower we would have lost £2 a point for every point movement lower, until it reaches your stoploss. Remember to monitor your risk with Stoplosses.

The question is How do I know what stake I need to put for the EURUSD? You can do this by calculating the average range. If you do this you will see that the Eur moves on average 80 to 120 points in a day. That is nice movements for scalpers.

Back to spread betting examples
Calculating the Average Range

Calculating the Average Range

I have decided to write this article on calculating the Average Range as it has helped me a lot understand in what kind of Market I am getting into, and helped me , and what I can expect from the market I am trading.

Lets start by understanding what is the average range, how to calculate it and then I will move on to why it is important.

The Average Range is calculate by taking the high and low of the time frame you are trading over a certain period of time. This will give you an idea of the average movement your trade will have over your chosen time period. Now lets put this in an example below:

Shares: Lets say you would like to take a spread bet on HSBC, but you are unsure on the kind of risk you can expect in one day. What you do is, go to yahoo finance or your data provider, download the latest data of the time frame you are trading. Ok. Let’s do it together.

1) Go to Yahoo Finance.

Yahoo Finance

2) Look for the share price using the name or ticker.

Get Quotes

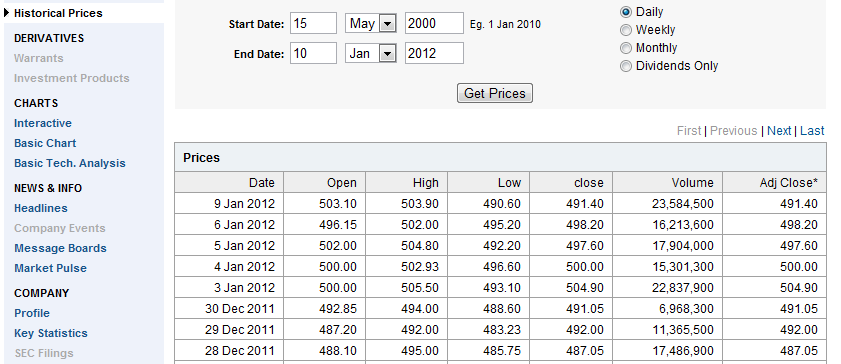
3) Go to the Historical Prices and download the latest historical prices.

Historical Prices

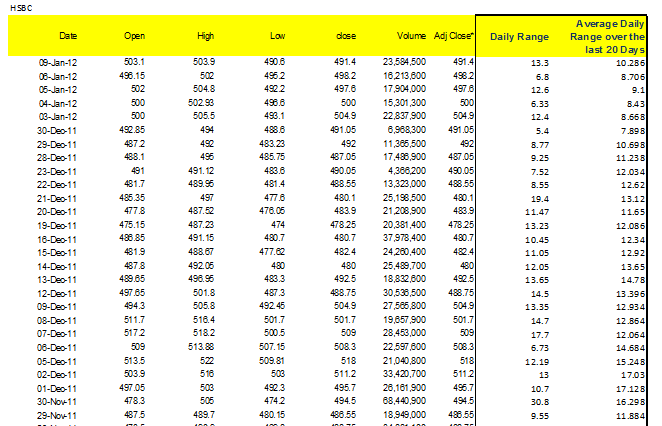
4) Once you have downloaded the prices take the High price + Low price and dive this by 2. This will give you the latest range. Do this Again for the last 20 Prices.

Average Range

Now I will explain why the Average Range can help your trading As you can see from above the Average Daily Range of HSBC is around 10 points a day. When you are trading and you are unsure of your size, this will give you an idea of the daily risk. You know HSBA.L is likely to move between 8-13 points a day, therefore if if decide to trade £10 a point, you are placing a trade with a potential risk of 80 to 130 points a day.


Download the excel sheet here


I hope you have enjoyed this, if you have any questions email me or add a comment, I will be happy to answer question.

Let’s Go one step further, Let’s see if we can calculate or predict HSBA’s High and low for today’s day might be.

Back to