FTSE100 BB Scalping strategy

Scalping Strategy–FTSE100  5 min Bollinger Bands scalping

Here is a very simple strategy but you do need to familiarize yourself with this strategy before you start using this strategy. It can be effective as it can stop you out quiet frequently. You can trade this on the FTSE100 on a 1min, 5min, 15 min time frame.

Do Not trade this ahead of important data or news.  Do Not Trade when there is a lot of strong bad news or good news in the market as the FTSE100 is likely to take a direction. Best to trade it after the FTSE open and before the 13.30 economic data or US open.  Unless the economic data that is coming out has no importance.

Settings:
Bollinger Bands 50 period, 2 Standard deviation (magenta)
Bollinger Bands 50 period, 3 Standard deviation (blue)
Bollinger Bands 50 period, 4 Standard deviation (orange
)

Spread betting Rules:
Go Long
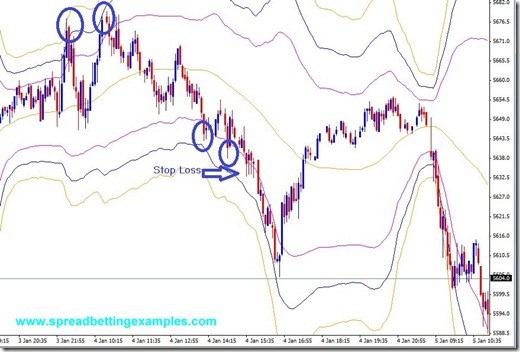
when the price crosses the first Bollinger Band (magenta) to the downside, moving towards the second Bollinger bands (Blue), when it fails to reach the blue band and moves back up, this is when you go long, with your stop loss below the low the candle.
If, instead, the prices cross the blue Bollinger band moving lower towards the orange Bollinger band but fail to break the orange band and moves back up towards the centre of the bands, again this is where you buy and go long with stoploss below the low of the candle. Remember, this time while the prices were moving lower they must not have stalled between the magenta and blue. If you get stopped out, just wait for the next signal.

Go short when the opposite happens.
Scenario A. Prices move higher breaking the magenta bollinger band but failing to reach the blue bollinger band. It moves back towards the centre of the bands, go short with stoploss just above the band.
Scenario B. Prices moves past the magenta and blue bands to then stall between blue and orange. At this point, as prices move back into the bands, tanke a short trade with stio above the spike candle.

In both scenarios, being patient and waiting for the correct setup, is the key to trading.

Ideal scenario: when the markets are trading sideways, or the market is quiet with news to come out in a few days and prices are mainly moving sideways with occasional runs up or down.

What to be careful with this is when there is very strong news and the FTSE100 takes a direction. This is a mean reversal strategy, and we don’t want the FTSE100 to move in one direction.


Below is a when the strategy works really well. Prices break the first bollinger band then retraces.


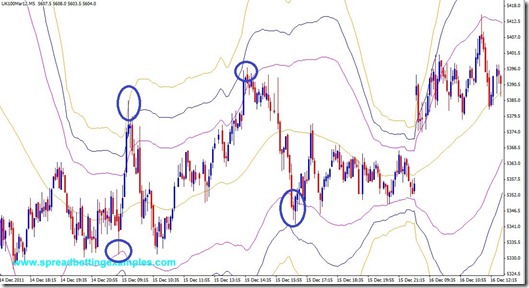
This is a second example of this . Here we get stopped out as soon as prices move in a trend. As you can see from the time, it is after 13.30. There was economic data that made the markets take a trend.
Any queries, post a comment and I will be happy to answer

Back to

Scalping Strategy – The Spike Scalping System

Scalping Strategy – The Spike Scalping System

This is a very simple scalping strategy, but at the same time does require quiet a bit of trading experience. It is scalping spikes. This strategy falls also under Price Action as there are no indicators’ involved. In this strategy Money management Rules are important, and this is the reason why many experienced traders with a strong understanding of support and resistance should trade this strategy. The Spike scalping strategy is a system that looks at pervious resistance and support areas, and waits for price to move back to these areas. Once prices reach the previous support or resistance, wait for the current candlestick to form a long spike but return to it’s starting point. Once the candle closes you can scalp 6-15 points in the opposite directions of the spike, with your stoploss above or below the spike. The Body of the candle must be smaller than the spike.

Here is a to show this strategy:

Scalping Strategy - The Spike Scalping System

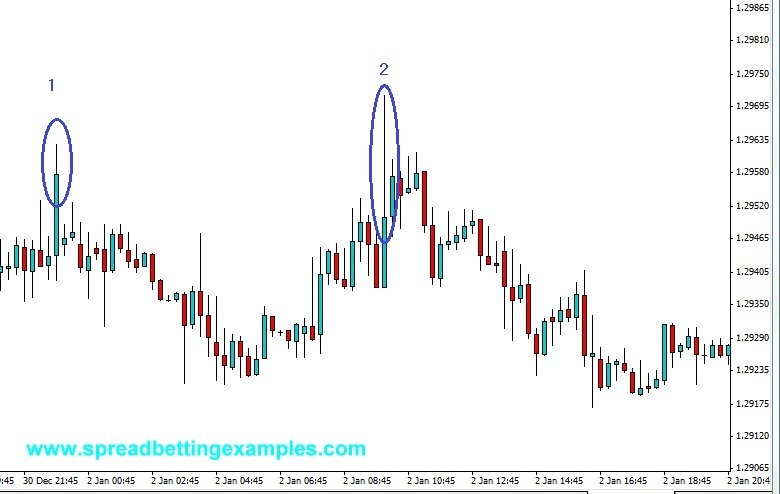
In this Scalping Strategy there was a previous resistance point at #1. This was a strong resistance. A Spread Better will wait for prices to test this level again.  In fact at point 2 prices re-test the previous resistance but fail to break this level. Your entry would be at the close of the candle with your stoploss above the high of the candlestick with the large spike.  In this case the spike was 25 points you would look for a 10 to 15 point profit. For those that would like to run their trades, they could do this, no longer being this a scalping strategy. The above scalping strategy is shown on a 15 min chart, to avoid Noise or fake support and resistances. In the case above, a spread better would look to enter a scalping strategy short.

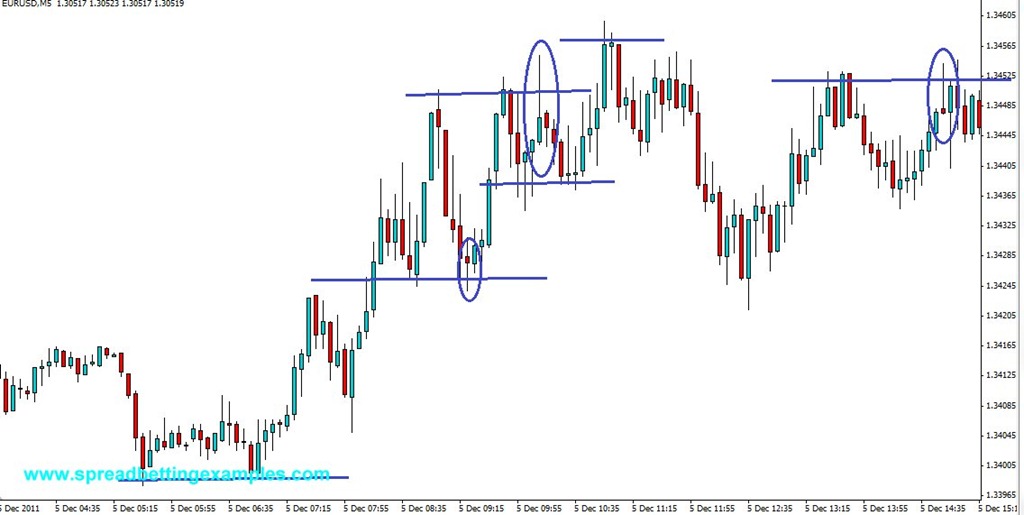
Below is a scalping strategy on a 5 minute chart. As you can see only when there has been a previous resistance or support level and the following candle that tests this level forms a big spike we enter a spread betting trade long or short. Looking to make 10-15 point out of the market.

As you can see from the spread betting example below, the circled candles have small bodies, big spikes in correspondence with previous support and resistance levels.


Scalping Strategy - The Spike Scalping System_5min


Back to

SPREAD BETTING EXAMPLES – Barclays Shares

SPREAD BETTING EXAMPLES – Barclays Shares


I  have always been of the opinion that the best way to learn a concept is through examples, and here I present a that applied to Barclays PLC  that will help your learn how to Spread Bet. So let’s get started.

Let’s say that you believe that Barclays shares were undervalued and that the market has sold them more on a small scare than a real change in company fundamentals. Therefore they have  a good chance of rising in the near future. One way of taking advantage of this oversold state, would be to invest money in Barclays and buy the actual company. If your analysis proved to be correct, and the share price did return to their correct value, you would sell your shares at a higher price, making a profit.

An alternative way of taking advantage of your opinion would be to make a spread bet, backing the price to move higher.

Most Spread betting companies have a two-way quote of prices, at which you can ‘buy’ (that is back the price to rise) or ‘sell’ (if you were expecting the price to fall). As it is a bet, all prices you do spread bet on will have an expiry. Normally the expiry co-insides with the expiry of the financial futures date. You cannot hold the spread bet forever, but you can close the bet any time you wish before the expiry date. Similar to conventional trading, you can close your trade at anytime.  Later I will expand on the expiry dates, but let’s keep it simple for now.  Let’s say that you only want to take a short term bet on Barc.l

(Below Spread Betting Example of Spread Betting on Barclays Shares)

Barclays Spread Betting Examples


On our Hourly Chart you see Barclays forming a support area at 170 and you decide to make an up-bet by buying waiting for it to reach 169-170 again and buying higher end of the quote (the difference between the sell and buy price is known as the ‘spread’, by the way, and is where spread betting obtains its name from).

Similar to Share Dealing, the bigger the deal size the more you risk or stand to make or lose money for a given movement in the price. In spread betting you don’t deal in numbers of shares or contracts, spread bets are denominated in a set Pound per Point movement. Let’s say you decide to buy £10 per point. This means that you will make or lose £10 for every point movement the share rises or falls .  184 is equivalent to £1.84 GBP the price of Barclays shares. Therefore one point movement is equivalent to one point movement. Therefore for every penny Barclays moves you will make or lose £10.

Over the next few hours the Barclays share price moves higher reaching 183-184 as you can see the picture in Barclays spread betting example.

You decide to sell your spread bet and take profit. You close your spread bet by ‘selling’ £10 per point at 183 (the lower end of the quote).

Your profit and Loss is calculated by subtracting the price you bought your Barclays share 170 from the price you sold your Barclays share at (183). You closed your bet 13 points higher making a profit of £130 profit.


Back to spread betting examples

Morning Star

Morning Star Japanese Candlestick Pattern

The Morning Star Pattern usually occurs at the bottom of the downtrend and is a bullish reversal pattern. The pattern has three components:

Day1)  Large Bearish Day: A long black candlestick.
Day2) A small Bullish or Bearish candlestick that gaps below the previous day’s close. This candlestick could also be a doji, in which case the pattern would be a morning doji star.
Day3) A long Bullish candlestick.

of the morning star.

Morning Star

The Morning Star pattern appears at the bottom of a downtrend with a first large bearish reversal candlestick pattern. The first day, the bears are definitely in control, often making new lows.

Day 2 begins with a bearish gap down. It is clear from that the bears are in control as this candle stick gaps lower. However, as the day proceeds, the bears are unable to push prices lower. The candlestick on Day 2 is often a small candlestick and can be bullish, bearish, or a Doji candlestick pattern (neutral/Indecision).

A bullish candlestick on Day 2 is a stronger sign of  turn in trend, indicating a possible reversal. But Day 3 is the highlight of the Morning Star Pattern, as it begins with a gap up. This is a strong bullish sign showing the bulls are in control, pushing prices higher, often reversing Day 1’s losses.

Morning Star Forex Spread Betting Example

The chart below of the Forex Spread betting pair EUR/GBP shows a spread betting example of a Morning Star bullish reversal pattern that occurred at the end of a downtrend:

EURGBP Morning Star

Day 1 of the Morning Star pattern in the EURGBP chart above was a strong red bearish red candle. Day 2 showed sign of reversal as the Day ended with a small positive sign after opening with a Gap Down. Day 2 Bears were unable to continue the downtrend of the previous day. Day 3 the bears tried again to push lower but failed and the bulls took strong control, Pushing aggressively upwards squeezing the bears out of the market and closing way above the close of Day 1. Both the downward trendline break and the classic Morning Star pattern gave traders a signal to go long and buy EURUSD Forex Spread betting pair.

The Morning Star pattern is a very strong three candlestick bullish reversal pattern. The opposite of the Morning Star Pattern is the Evening Star pattern, a bearish pattern (see: Evening Star).

Back to

CCI -1 Min Scalping System

CCI -1 Min Scalping System

This is Forex spread betting scalping strategy, I have used it on an MT4 but can also be applied to other charts
Trade From 8am UK time to 16 UK Time

Time Frame: 1 min

Forex Spread Betting Rules:

Trade Long:
Indicator: CCI (170)
Wait for the CCI 170 to cross the 0 Line showing an uptrend. It must be the first indicator to cross.
Indicator: CCI (34)
Wait for the CCI 34 to cross above the 0 line, also showing an uptrend. This must be the  second indicator to cross in the same direction as the CCI 170
Indicator: RSI
Price must be above the 14 Moving average

Trade Short: (opposite to the above)
Indicator: CCI 170
Wait for the commodity Channel Index (CCI) 170 to cross below 0 line, showing a down trend, and again t must be the first indicator to cross.
Indicator: CCI 34
Wait for the commodity Channel Index (CCI) 34 to cross below 0 line, showing a down trend, and again t must be the second indicator to cross.
Price must be below the 14 Moving average

Settings:
CCI 170 PERIOD 170
CCI 34 PERIOD 34
Moving Average 14

Important: This system relies heavily on support resistance, Fibonacci levels and pivot points. so if you are near near a support and resistance line, wait to see what the price reaction will be. Wait to see if prices break the support and resistance or bounce off these levels. Always follow the trend and look to buy and tops and bottoms.

Forex Spread Betting Examples of the CCI -1 Min Scalping System applied to the EURUSD:

CCI -1 Min Scalping System

In the spread betting example, you can see I only took the longs trades as only in the long signals did the Commodity Channel Index 170 cross above the 0 line before the Commodity Channel Index 34


I Thank Canadian Dude for inspiring this Forex Spread Betting Strategy.

Back to

Japanese Candlestick Basics

Japanese Candlestick Basics

Candlesticks are the most basic form of chart reading. The Japanese started using candlesticks in the 17th Century. They are very simple to use but very rich in interpretation. Many Price Action Technical Analysts or traders use only candlesticks to trade, as indicators are latent to price movements.

There are two types of candlesticks:
Bullish: When the closing price is higher than the opening price. Prices have moved higher.
Bearish: When the closing price is lower than the opening price. Prices have moved lower.


Japanese Candlestick


Candlestick components

Upper shadow: is the vertical line above the body f the candle. Goes from high to close (bullish candle) or open (bearish candle)
Real body: is the difference between the open and the close
Lower shadow: is the vertical line below the body. It goes from the low of the candle to the close (bearish candle) or open (bullish candle).

Candlestick Patterns
In the candlesticks you can see human emotions. There are many candlesticks, and are either reversal of continuation patterns, greed or fear.


Back To

Elliot Wave

Elliot Wave

Elliott Wave Principle is a form of technical analysis that some traders use to analyse financial market cycles and forecast market trends
Elliot wave were discovered by the professional accountant, Ralph Nelson Elliott (1871–1948). He stated that prices move in waves. These waves repeat in cycles over and over again. The waves are:
(1) move up, (2) partial retracement, (3) Move up, (4) retracement, (5) the final move up. Then starts the retracements cycle: (A) Full retracement (b) partial retracement, (c) a full move downward. Then the two cycles start again.  Look at the below to see the cycles. This picture was taken from Steve Nison’s book: “Japanese Candlestick Charting Techniques”.


elliotw1

Below you can see the various cycles. The Elliot Wave cycle repeats in both macro and micro time frames, as you can see above:

  • GrandSupercycle
  • Supercycle
  • Cycle
  • Primary
  • Intermediate
  • Minor
  • Minute
  • Minuette
  • Sub-Minuette
  • elliotwaves


Let’s go through a Spread trading example of how the Elliot waves are applied to spread betting strategies:


Elliot Waves


How to spread bet with the trade the Elliot waves:

Elliott Wave is based on crowd psychology. There are two types of waves the  impulsive wave and corrective wave, booms and busts, rallies and retracements.
The Elliot waves tell traders where trends are likely to stop or come to a halt, and these are areas where they take advantage of placing their buys or profit areas.
The chart above illustrates the Elliott Wave pattern applied to EURUSD.

As the A,B,C corrective Waves finish we have the first leg upwards 1. When the upward movement seems to have finished ad starts turning the traders look at putting their buy orders at the 38% retracement, and looking for an upward extension of the wave 3. In the EURUSD above, the prices bounced off the 38% retracement moved a little higher, then came back down and stopped out the traders that had bought at the 38% retracement.  The spread betters decide now to wait for the 50% retracement and place their buys again. At the 50% retracement they are looking to do the same trade, run it until the extension of wave 3, which is 1.618 projection upwards. The Elliot waves are based on the Fibonacci levels. Once money has been made, they wait for the 38% retracement again at level 4. After the last move higher finishing in wave 5. Traders are expecting now a corrective wave.

Spread betters would now not go against the trend but wait for a retracement of the first A wave down, at point B (retracement) and Short the EURUSD on the C leg all the way down to 100% retracement. On the other hand, Some spread betters wait for the C wave to complete then trade long. They would use the 61% (golden Fibonacci ratio) and 100% retracement to see/expect where the wave will end.

Further reading would be the Fibonacci Levels

Back to simple spread betting strategies

Gravestone Doji

Gravestone Doji

On the other hand we have the Gravestone Doji, which is a strong bearish candlestick pattern that occurs at the top of bull trend, often near the highs.

GravestoneDoji

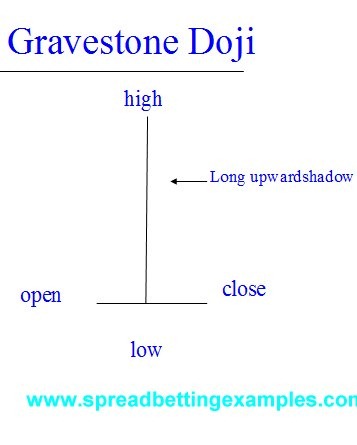
The Gravestone Doji, as a typical Doji has it’s opening and closing at close to the same price. Rarely these two prices are the same price. However the most important feature of the Gravestone doji is that it has a long upward shadow.

This long shadow implies that the market tries to make new highs but find strong bearish resistance that push it all the way down to where prices started off, or opened. Therefore there is an overpowering of the bears over the bulls.

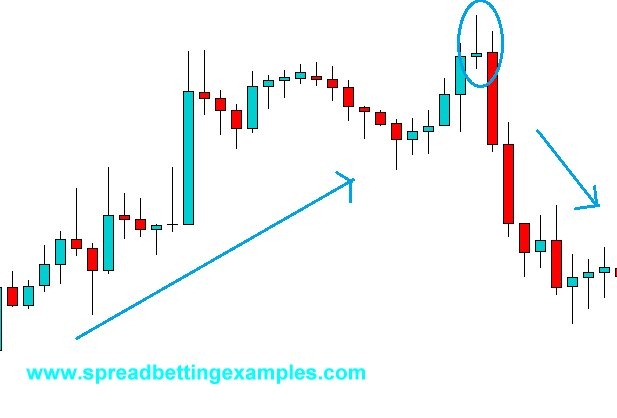
Below is a of the Gravestone Doji in a Forex EURUSD trade.


Gravestone Doji

As you can see prices were heading higher in an uptrend, slowed down, then tried to push higher until the bulls found bears defending the higher prices. These bears pushed the prices back to the candlestick’s opening price (gravestone Doji). The candlestick that followed was a strong bearish candlestick.

The Gravestone Doji is extremely helpful to indicate where there is strong resistance. If this resistance is broken we can find a substantial move higher.

In a spread betting system a trader would wait for the following bearish candlestick after the Gravestone Doji, as confirmation of the trend reversal. It is important to use a confirming candlestick. Some more aggressive traders would enter as the Gravestone Doji is formed; maybe with smaller stakes taking on smaller risks.


Back to

Back to candlestick patterns

Doji Candlestick

Doji Candlestick

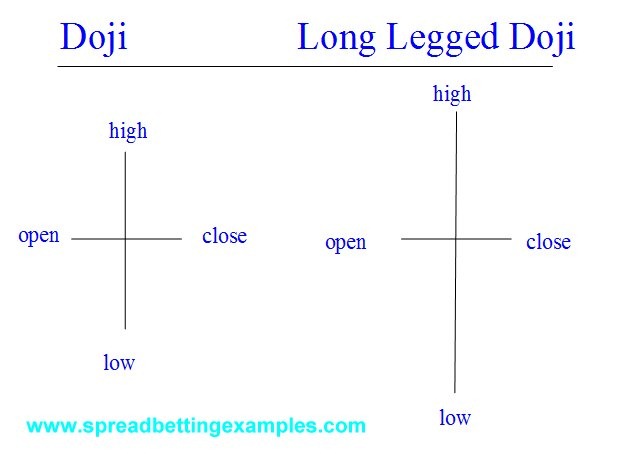
A doji is a very strong candle it show a lot of indecision between the bulls and the bears. Often a Doji is sign of reversal but can also be sign of a continuation. Doji’s are normally found at the bottom of a downtrend. Doji refers to both singular and plural.

The formation of the Doji is when the opening and closing price are the same. When the shadow of the Doji is extremely long this type of Doji is called a long legged doji. Then we have the “Rickshaw Man” which is also a Doji but the difference is that the Rickshaw Man has the opening and closing in the middle of the candle.

The Doji represents indecision, as the bears push prices higher, but then the bulls come in and fight prices lower to then end up at the starting point or opening price.

Doji


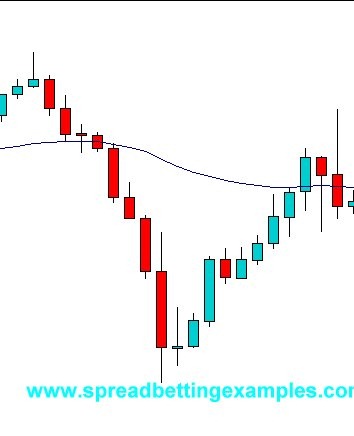
Below is a of a Doji formed in a down trend. As you can see the prices were heading lower until the bears started running out of steam and the bulls took over at the end of the downtrend but were pushed back closing in line with the opening price. The following candle the bulls give it a second chance to gain ground and start pushing prices higher. When a Doji manifests it’self this is a reversal warning signal that there might be a change in trend. This signals either to start scaling down on your position, closing your position or to monitor and be on the alert of a price trend change.

The Doji, is a strong indecision candle but not necessarily a reversal candle, hence it is more a warning candlestick than an actual reversal signal.

Forex Spreadbetting Doji on AUDUSD

Doji_1

While looking at your spreadbetting charts always keep an eye out for the Doji. You can also implement this in a spread betting strategy, but do keep in mind that it is more a warning sign than an actual reversal pattern. Now that we have seen what is a Doji, let’s look at intra day how it is formed.

This is a spread betting example of the Doji intra day. There are many ways of forming a Doji.

Doji_formation

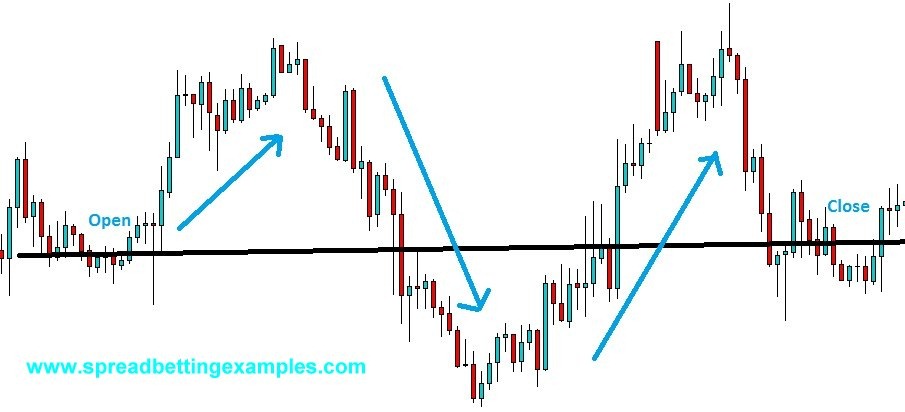
Prices opened the day after the overnight drift, heading higher, but soon the bears came in pushing prices lower continuing with the main trend down. Prices make new lows but these lows are defended buy the bulls that push prices higher to then return to the opening price.

There are other powerful Doji Patterns

  • Dragonfly Doji
  • Gravestone Doji


Go back to spread betting candlesticks

Double 14 EMA and Parabolic SAR

Spread betting system Double 14 EMA and Parabolic SAR

This system is quiet simple to follow.  You have three spreadbetting indicators setup on your charts:

EMA 14 on the high
EMA 14 on the low
Parbolic SAR

Spread betting system

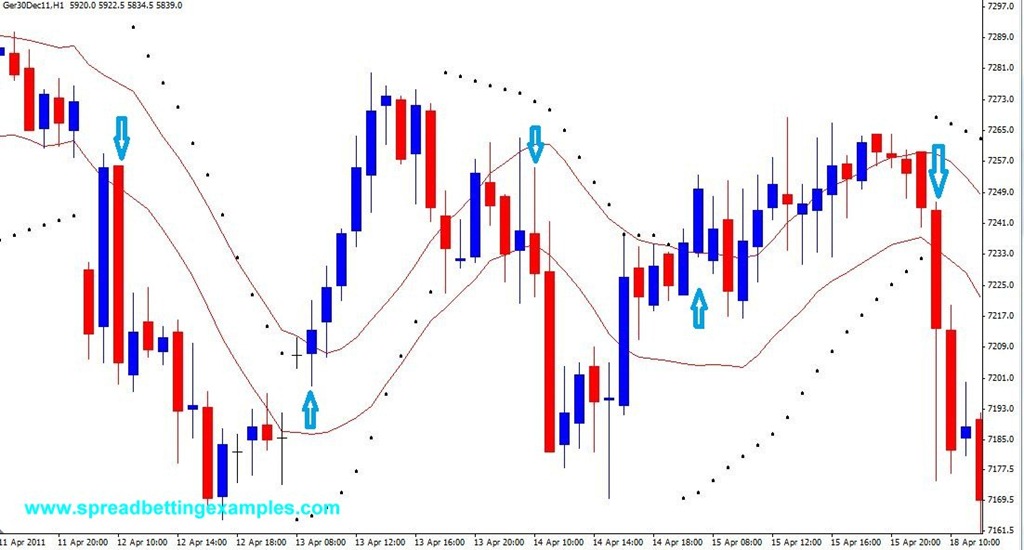
Spreadbet Long when the prices break above the EMA 14 high and close above. The Parabolic SAR must be below the prices and vice versa: Spreadbet short when the prices break to the downside below the EMA 14 low and the Parabolic SAR is above the price. For those

Time Frame to use: You can try this system on various time frames, as long as when you apply your stoploss you know what 1 Average Unit of trading is. Example, I have applied this system to the DAX 1 HR chart, and the average movement of the germany30 is 30 points.

Risk/Stoploss: My stop loss that I apply is around 40 points and I look for a target of 40 – 60 points, depending on how strong the news is in the market

Important is that you apply rigidly your money management rules as like many moving average cross systems this works wonders in a trending moving market or a market that has a lot of news. Try to avoid trading during big news announcements as there will be a lot of whipsaw volatility in the markets

********************************

Type:Trend preferably /reversal
Timeframe of trade: Swing

********************************

see the Spread betting example below see

Double EMA and PARSAR_

********************************

This spread betting system of the Double 14 EMA and Parabolic SAR can be applied to any instrument (FTSE, DJI, S&P, Forex: EurUsd, GBP, JPY, AUD, CAD, CHF, Commodities: Oil, Gold, Shares )as long as you apply good money management rules and it is a market that has movement.

Back to