Price Action- Three Black Crows

Price Action- Three Black Crows

This is a very simple setup. No indicators needed just simple price action. You do need to know your candlestick patterns. I will give you all the patterns you need to know and their explanations. This spread betting strategy is applied to BARCLAYS spreadbetting  shares , but it is a pattern you can also apply to Forex spread betting, commodities, Indices.

The main setup is to look for prices moving higher in a minor or major price trend. When the retracement occurs and the retracement is a 3 black crow candlestick pattern that stalls on the Moving Average (10 – 20 – 50) this is a good indicator to buy the shares. See the spreadbetting example below:
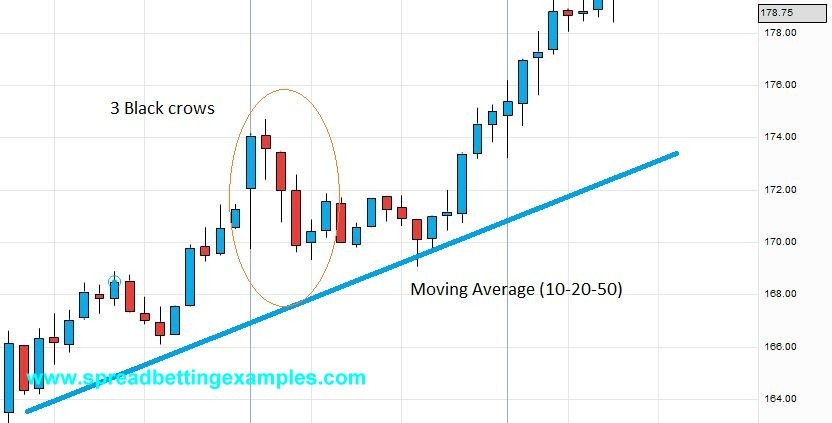
 

Price Action- Three  Black crows-Barclays_c

The buy signal after the 3 black crow candlesticks is stronger if followed by a bullish pattern like the bullish harami pattern:
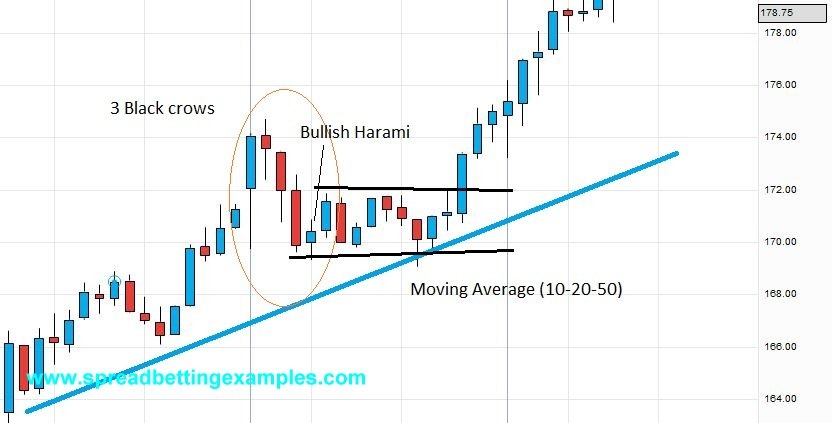
Price Action- Three  Black crows-Barclays_e

The down trend stalls, runs into a sideways movement then followed by a breakout.

here is another of the three 3 black crow candlesticks followed by a Gap up pattern. If the Gap up window is not closed this becomes a support and short term bullish pattern.
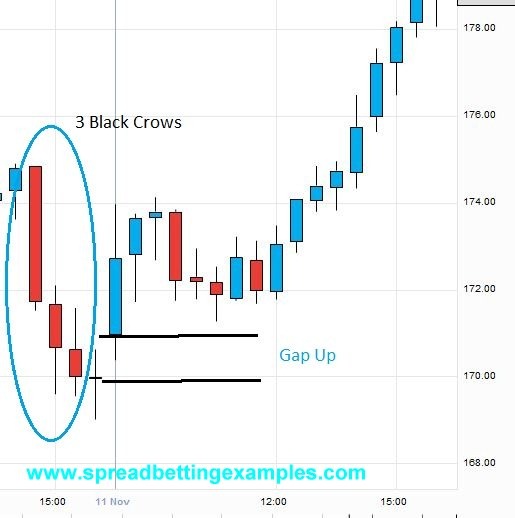
Price Action- Three  Black crows-gap-Barclays_b


A variation of this spread betting system, is to look for the three black crows on the daily chart. If the forth day does not fall further and a sideways trend occurs on a 15 min time frame.  In the bigger picture you will see three black crows followed by a Bullish Harami. On the 5th day look for a break out from the previous day’s range to the up side.
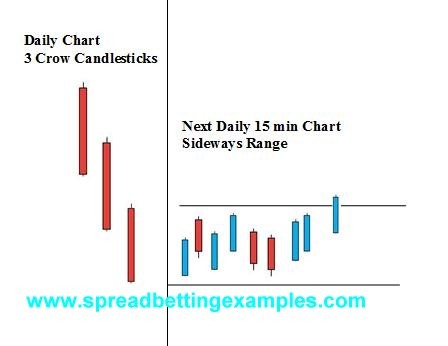
Price Action- Three  Black crows(1)

what does it look like on a daily chart:
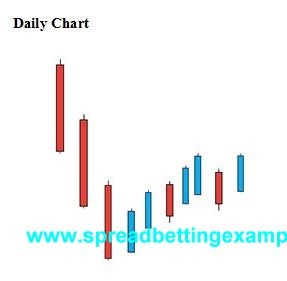
Price Action- Three  Black crows_b(1)


As prices move higher use your money management to move your stoploss higher.

Back to Advanced Spreadbetting systems
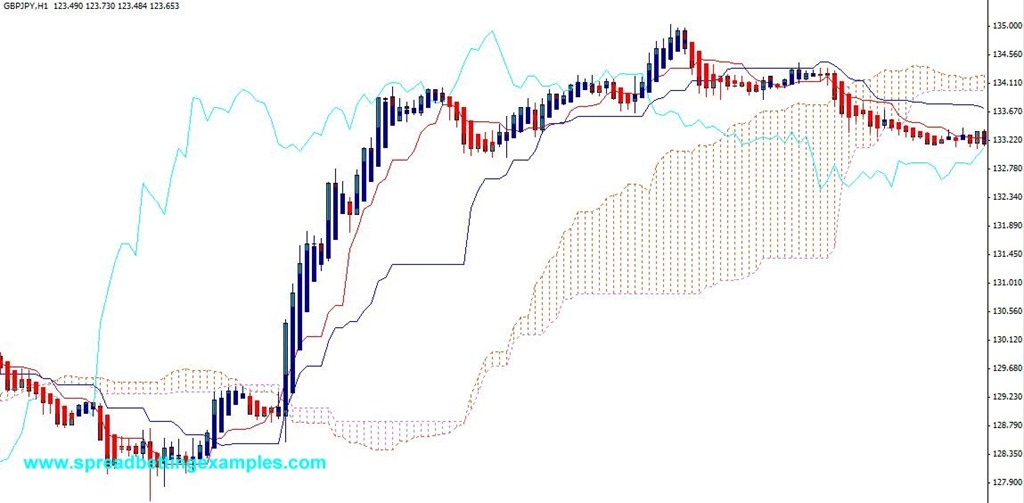
Heiken Ashi and Ichimoku cloud

Advanced Spread betting system- Heiken Ashi and Ichimoku cloud

I found this strategy on Forex factory. I have tried it on smaller time frames, but will run the spread betting system on a higher Time frame. This system is part of the as those who apply it should have some understanding of the (Ichimoku cloud) charts and the . I have added a brief explanation in the technical Indicator section.

Description
This is a relatively easy spread betting system. It requires a lot of patience, as more indicators you use the greater the patience needed for the signal to occur. I applied this strategy on the GBPJPY.

Spread-betting long:
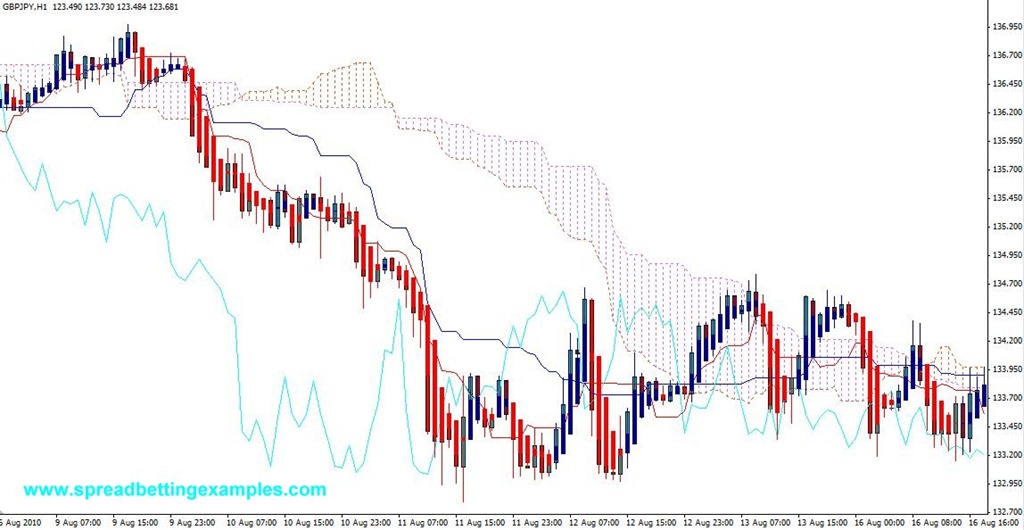
The signal: Wait for the Heiken Ashi candlestick bust be above and close above the Kumo. Once the Tenkan Sen has crossed above the Kijun Sen; The Chikou Span must be above the prices and heading higher. Instead in the cloud, the Senkou Span-A would have crossed above the Senkou Span-B; Heiken Ashi candlestick must be  positive blue candle.
For those that have a higher risk tolerance they can ignore the Chikou Span.

Trading system - Heiken Ashi and Ichimoku buy signal


Spread-betting short:
On the other hand we have a spread bet short which is completely the opposite to the spread betting long. Entry signal would be:
Wait for the Heiken Ashi candlestick bust be below and close below the Kumo. The Tenkan Sen would have crossed the Kijun Sen to the downside; the Chikou Span must be below the prices and heading lower. Instead in the cloud, the Senkou Span A would have crossed the Senkou Span B  to the downside; Heiken Ashi candlestick must be  a negative red candle.

Trading system -Heiken Ashi and Ichimoku sell signal


Your exit strategy:
You will exit either when your money management rules, tell you. Do not risk more than 2-5% of your account or if the trade goes your way wait for the Tenkan Sen to cross the Kijun Sen in the opposite direction.
This is a trend following strategy so you want to try stay in as long as possible.

********************************
Time frame: 1Hr
Tag: GBPJPY
Indicators used : (Ichimoku cloud) and the .
Charts used: GBPJPY
Type:Trend
Timeframe of trade: Swing
********************************

Back to

Price Action-1-2-3 Trade system

Price Action–1-2-3 Trade system

This strategy is a very simple and logical strategy used throughout the trading world. The Price Action 123 Spread betting Trade System takes a new trade when prices fail to make new highs or new lows.  The below is set on a 4HR chart but this can be used on any time frame. I have also pictured this strategy on the EURUSD. This is my favourite pair and the forex spreadbetting pair I specialize in.

There are no indicators, it is all price action. This is considered a reversal strategy.

********************************
Summary
Time frame: 4HR
Tag: EURUSD
Indicators used : None
Type: Price Action
Timeframe of trade: Swing

********************************

Entry Rules:

Entry occurs after a trend has been underway for sometime, and prices have reached extreme levels. These levels will no longer be sustainable, and prices will fail to make new lows or new highs.

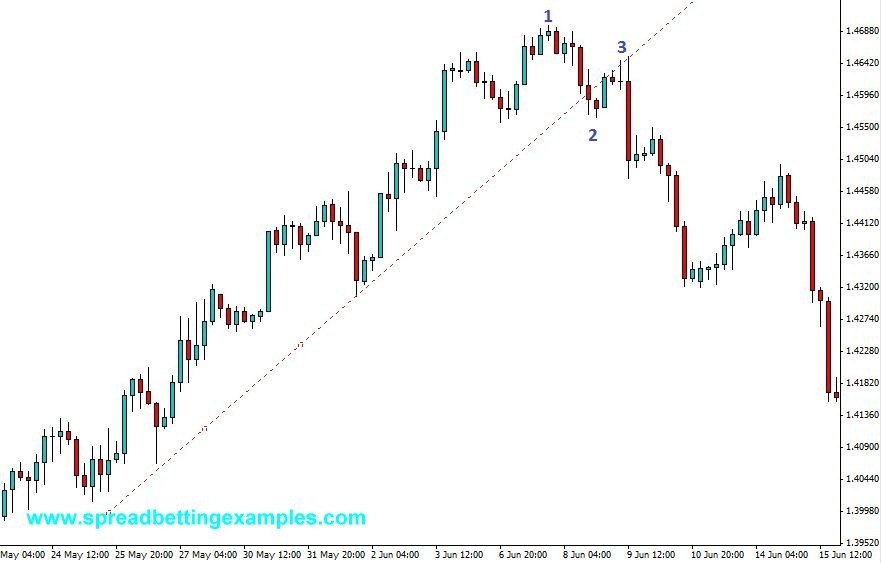
Below is a spread betting example of the Price Action–1-2-3 spread betting system.


Price Action–1-2-3 Trade system

Spread-betting short:

This is opposite to the above entry signal; instead prices have reached new highs and fail to move higher, interrupting the up trend.

A) 123 – Lower High
After prices have been making new highs and higher Lows, the new highs are not sustainable anymore and the highs make a lower high (3). Here the bears have overpowered the bulls and it is time to trade short unless you a conservative trader that you wait for prices to bear point (2).

B) 123- Double top.
Similar to the above scenario, you will instead have prices form a double top at the highs, fail to break the highs and move lower. Here is your entry signal, or, again if you are a less aggressive trader wait for the prices to break point 2.


Spread-betting long:

There are two buy scenarios:
A) 123 – Higher Low
This scenario is when prices have been falling making Lower Lows and Lower Highs. At the end of the downtrend the low does not make a new low, but makes a higher low. Now you can spreadbet long when prices fail to make a new low. A less aggressive trader will wait for the prices to move higher past point 2 then he buys.

B) 123- Double Bottom
In this scenario, at the end of the downtrend the low does not make a new low, but makes a double bottom, not breaking into new lows. This is a signal to trade long. A less aggressive trader will wait for the prices to move higher past point 2 then trade long.


Exit Rules:
Exit the trade either at target profit or when the opposite signal occurs, that is when the trend fails to continue and new highs or lows fail. Use your money management rules

********************************


Back to Advanced spreadbetting strategies

Price Action System-morning break out

Price Action System–morning break out

Forex Spread betting

There are many morning break out strategies you will find on the web. I have fount this one to be the most effective.

Time frame: 30 min
Tag: EURUSD
Indicators used : None
Charts used: EURUSD
Type:Trend Trade
Timeframe of trade: Day trade or Swing

********************************

This strategy is very simple, but an advanced spreadbetting strategy as you do need a some trading experience. Look for the overnight range on EURUSD. The optimal setup is when the rage is under 1/3 of the average range and that the overnight range is either in the upper half or the lower half of the previous day’s range.
The overnight range is considered between 20.00 and 8 am UK Time(when the UK stock market opens). soon after the opening you will have big players come into the market and they will push the price in one or the other direction.

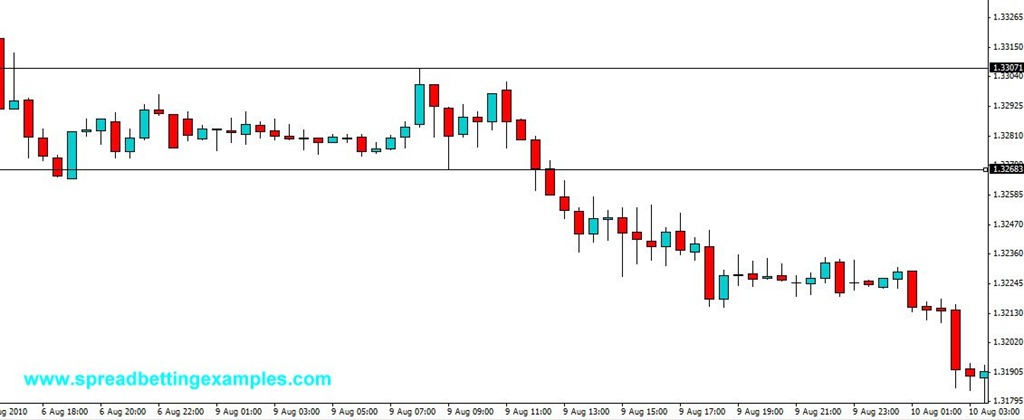
Wait for a break out of the overnight range. When there is a pull back towards the range, enter the trade in the direction of the pull back. Look at the example in Spreadbetting example 1:

Price Action System–morning break out2

In the Price action system above. The overnight range was between 1.3307 and 1.3268 .  39 point’s which is roughly 1/3 of the average range of EURUSD. This range formed near the low of the previous range. In the example above there is not a real pullback into the range but there is a strong pause at 1.3250. This pause is considered a pullback in price action.


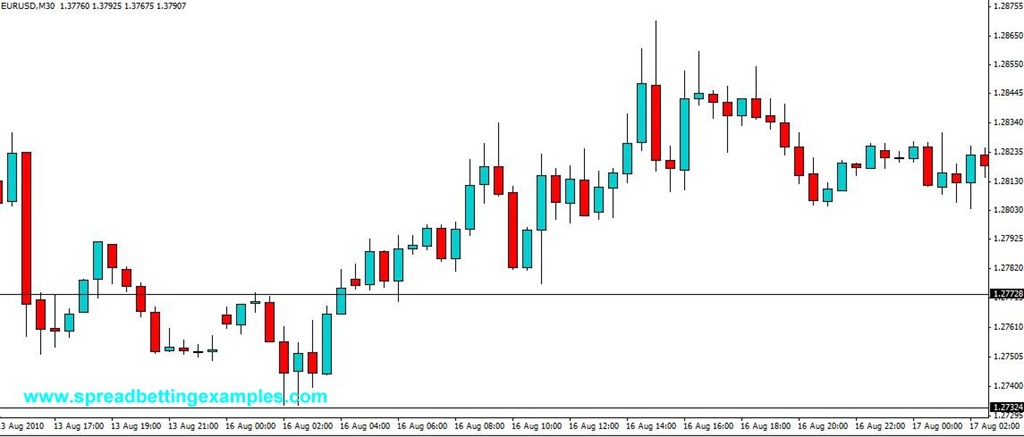
Price Action System–morning break out3

Above is another Forex spreadbetting example of the morning break out strategy. In picture above, the price action has a retracement in the morning back to the resistance line that has become support. This is where you enter the trade.
You only trade one trade a day, on the optimal setup. If you are a more aggressive trader you could use a stop and reverse strategy.

Exit Rules:

Your profit target is 2/3 of an average day range or target of one full day’s range if you would like to keep it overnight.
Your stop loss is the middle of the overnight range. If after the breakout the trade falls back into range crossing the middle of the overnight range. There is a greater chance that the trend will be in the opposite direction, to the current breakout. Therefore this is your stoploss are.

********************************

Back to Advanced Spread betting strategy

Hammer

Hammer

Bullish Reversal Pattern

What is a hammer?

The is a bullish reversal candlestick. Most bullish reversal patterns this pattern will

-occur within a downtrend or at the bottom of a trend
-Often it is followed by a confirmation candle.

Be aware with bullish reversal candlesticks this is a warning sign of  a possible change in trend, but it is not a signal. Traders normally look for confirmation of a change of trend on the next candle.

Formation:

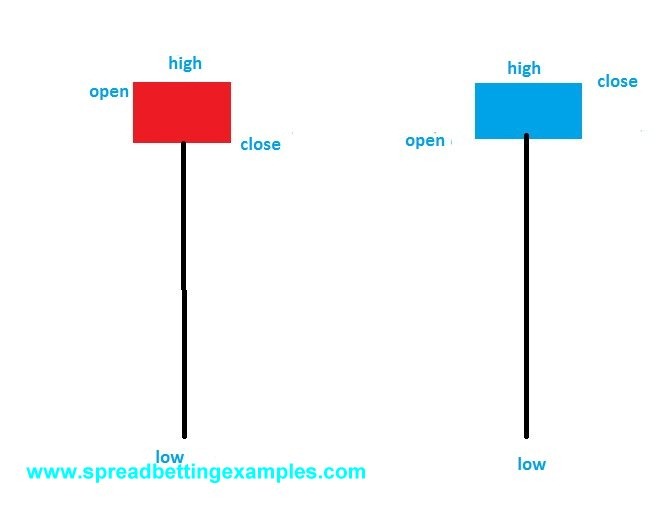
The formation of the hammer , very similar to a hanging man  , this is created when the opening, closing and low prices of the candlestick are in the same area. The hammer will have a long downward shadow. Normally the shadow is 2 to 3 times the size of the body.  The main difference between the hammer and the hanging man is that the hammer occurs at the bottom of the trend and it is a bullish reversal pattern, instead the hanging man occurs at the top of a trend and it is a bearish reversal pattern.

The hammer as the hanging man is created when we get to an oversold area or support point where the bulls are strong. The bulls will stop the prices from moving any lower and push them back up to the opening price. On the next candle the bulls will push the prices higher. This shows a change in strength and the bulls taking control.

The hammer is a strong reversal pattern.

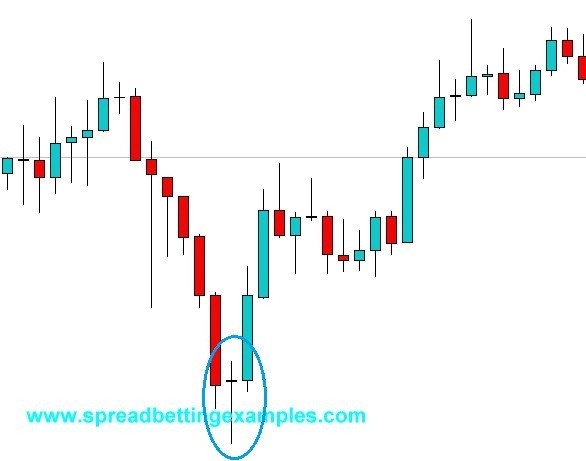
A hammer is often applied to many price action spread betting strategies. Below is a spread betting example of the hammer.

Hammer


How to trade the hammer?

Below is a Forex Spread betting example of the EURUSD.  As you can see prices started falling until the bears met with the bulls that were strong enough to turn around the prices. In a trading strategy the hammer is your warning signal of a change of trend. The candle stick that follows is a strong bullish candle as it closes near it’s highs. On the close of the confirmation candle will conservative traders enter a new trade.


Hammer_EURUSD_2


Back to Spread betting candlestick patterns

Hanging Man

Hanging Man

Bearish Reversal Pattern

The hanging man is a bearish reversal candlestick. Most bearish reversal patterns this pattern will

-occur within an uptrend or at the top of a trend
-Often it is followed by a confirmation candle.

Remember with bullish reversal candlesticks, these are warning sign of  a possible change in trend, but it is not a signal. Traders normally wait for confirmation of a change of trend on the next candle.

Formation:

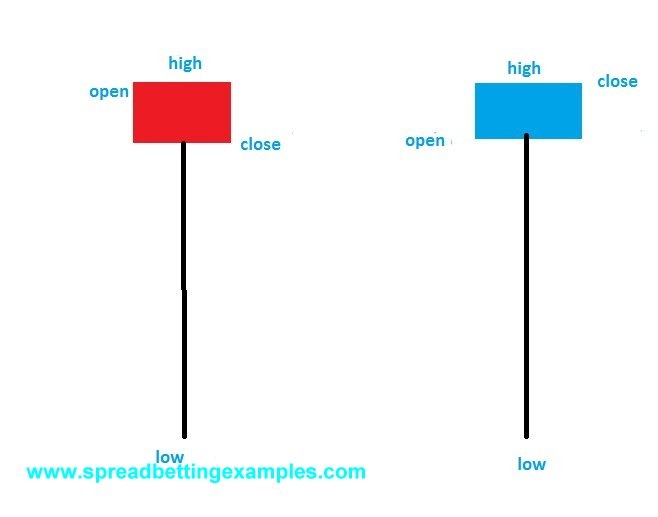
The formation of the hanging man , very similar to a hammer, this is created when the opening, closing and low prices on a candlestick are in the same area. The hanging man will have a long downward shadow. Normally the shadow is 2 to 3 times the size of the body.  The main difference between the hammer and the hanging man is that the hammer occurs at the bottom of the trend and it is a bullish reversal pattern, instead the hanging man occurs at the top of a trend and it is a bearish reversal pattern.

The hanging man is created because the moment we get to an overbought level or a resistance point where the bears are strong, they stop the prices from moving any higher. On the next candle the bears actually push the prices lower. This shows a change in strength and the bears pushing prices back down.


The hanging man is not as strong reversal pattern as the shooting star.

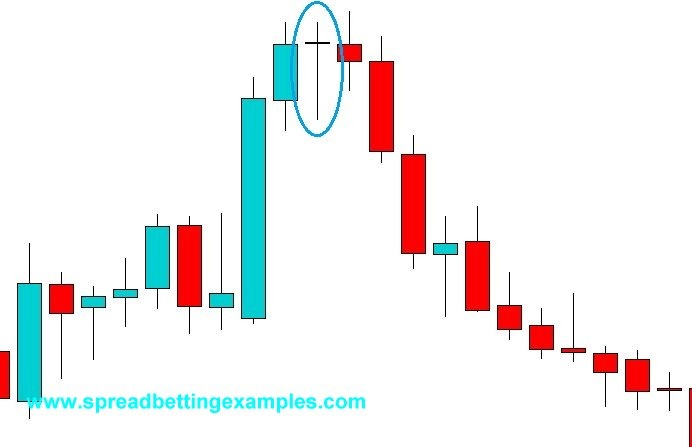
A hanging man is often applied to many price action spread betting strategies. Below is a spread betting example of the hanging man.


Hanging Man


How to trade the hanging man?

Below is a Forex Spreadbetting example of the hammer in GBPUSD. As you can see the bulls were in control, pushing prices higher until they met resistance. In the hammer the bears pushed the prices lower but the bulls were able to give a last push higher, forming the hanging man. On the next candle the bears took control and pushed prices lower.


Hanging Man_GBPUSD_


Back to Spread betting candlestick patterns

FTSE 100 price action scalping

Time frame: 5 Min / 1 min

FTSE 100

Indicators used / Settings: none  / Price Action

********************************

Entry Rules:

This is a very simple strategy that uses no indicators only price action based on candlestick patterns. I use this scalping strategy on the FTSE 100 trading. It requires a lot of patience but is a very effective trading strategy.  Wait for  shooting star or a hammer to form then enter on the open of the next bar.

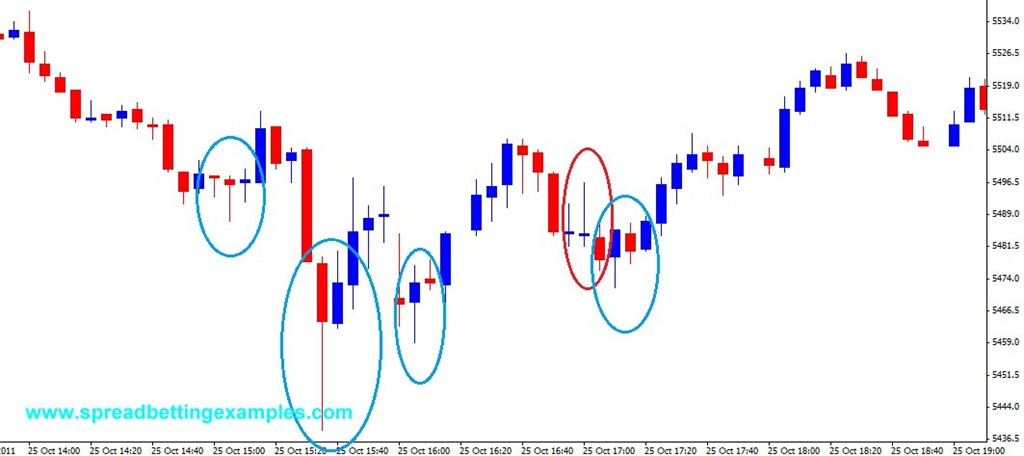
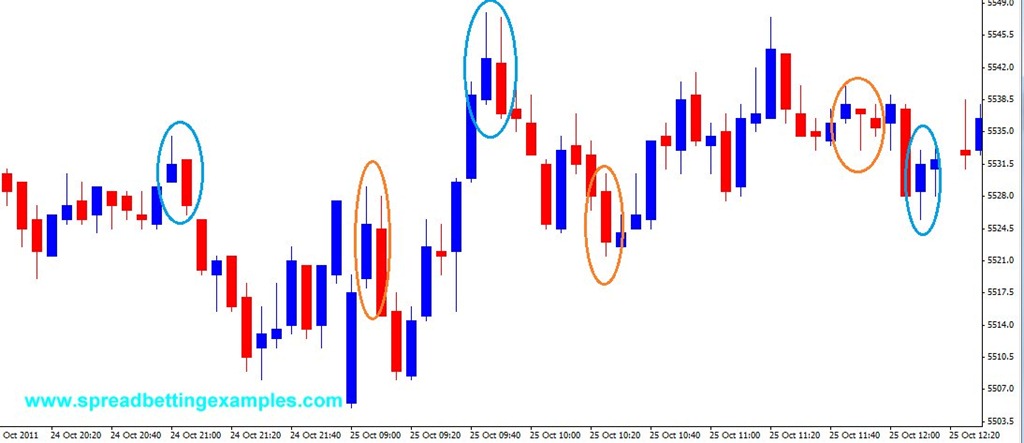
In the Pictures below the blue circles indicate YES TRADE . The red circles are NO TRADE.


Spreadbetting long:

Spread bet long when a hammer forms near the current lows. In the first example you can see this spread betting scalping strategy applied in the first and second blue circles.

Do not trade when the hammer forms while the prices are moving higher. The example in the second picture below, the third red circle is a failed hammer as it occurs within an up trend.

Spread-betting short:

When to short the FTSE100? when a shooting star forms near the current highs. The signal is stronger if the shooting star forms at a resistance level. Furthermore the longer the shadow, the stronger the signal. In the second spreadbetting example below(pic2), the body of the shooting star is relatively small to it’s shadow(first and third blue circle) – this is a strong signal and one to trade. The second circle (red) you can see the shadow is not that long compared to the  body. This is a riskier trade, and don’t suggest to take.

Exit Rules:

This is a Spread betting scalping strategy, so to take 5 max 10 points out of the market.  Your stoploss above / below the low or high of the shadow.

When it works best?

After a rally or a decline and approaching support or resistance

Here is a spread betting example of this FTSE 100 price action scalping strategy

Spread betting example 1

FTSE 100 price action scalping


Spread betting example 2

FTSE 100 price action scalping2

Return to spread betting scalping systems

Bulls and Bears

Bulls and Bears

Bulls are when buyers are in control driving up the stock market

Bears are when sellers are in control driving down the stock market


Bull Market and Bear Market

Bull market describes a longer term trend of the stock market, when the Bulls are in control over a longer period of time

Bear market are when sellers are in control driving down the stock market


Where did Bulls and Bears get their name from?

The actual origins of these expressions are unclear. Here are two of the most frequent explanations given:
The terms “bear” and “bull” are thought to derive from the way in which each animal attacks its opponents. That is, a bull will thrust its horns up into the air, while a bear will swipe down. These actions were then related metaphorically to the movement of a market: if the trend was up, it was considered a bull market; if the trend was down,  it was a bear market.

Historically, the middlemen of bearskins would sell skins they did not own yet. This was an early form of speculating on the future price of these skins . The trappers would profit from a spread – the difference between the cost price and the selling price. These middlemen became known as “bears”, short for bearskin jobbers.  The term stuck for describing a downturn in the market

On the other hand, because bears and bulls were widely considered to be opposites, due to the bull-and-bear fights, the term bull stands as the opposite of bears.


Back to Financial Spreadbetting Glossary