Spread Trading with the MACD Histogram

The MACD Histogram is very good strength indicator / momentum indicator. The Histogram is constructed by the difference between the Fast MACD line (green Line) and the slower MACD Signal Line (blue Line).

The moment the faster MACD Line moves faster that the the MACD Signal Line, this creates a bigger gap between the two and the Histogram increases as it measures the difference between the tow. Therefore if a stock is having short term strength relative to it’s previous trend the histogram will in increase. If the trend in the short term has changed and the gap narrows the histogram will decrease.


A spread betting strategy is to trade this change of direction or strength, is to:

Spread bet Long:

When the histogram has been in a downtrend and now starts flattening and changing direction to the upside.

Spread bet Short:

when the histogram has been in an uptrend and now starts flattening and changing direction to the downside.


what you are doing is that you are capturing the momentum trade.


FTSE 100 -MACD Histogram spreadtrading


Next: Spread Betting the MACD Convergence Divergence

Previous: Spread Trading the MACD Moving Average

Exponential Moving Averages

Exponential Moving Averages

The exponential moving average also known as the exponential smoothing. This indicator is the one preferred by technical analysts of the various different moving averages, as it is a balance between the simple moving average, that lags and the weighted moving average that is over sensitive.

The simple moving average gives more weight to the current prices. Therefore it’s advantage is that it is quicker and follows the prices better. The disadvantage is that it ism more prone to whipsaw than the simple moving average.

From the chart you can see the difference between the simple moving average and the exponential moving average.

FTSE 100 - Exponetial Moving Average

As you can see the Exponential moving average follows the FTSE 100 closer. The SMA (Simple Moving Average) is less sensitive to price movement.


Now I will show you a spread betting strategy of two moving average cross and how the two different  averages react.


FTSE INDEX - 2 Exponential Moving Average Crossover_b


FTSE INDEX - 2 Simple Moving Average Crossover_b

You can see above how the exponential moving average crosses earlier than the simple moving average. giving you an earlier short spread betting signal. But it also gives you an earlier signal to close out your trade.

when deciding which spread betting strategy to use. You must decide which moving average will fit your style of trading. You could also mix the two. using an EMA to enter and a SMA to exit.


Next:Weighted Moving average

Moving Averages, Simple and Exponential

Moving Averages, Simple and Exponential

This Indicator is often used in various spreadbet strategies.

The moving average is a simple average price of the last n prices.  This is a lagging indicator, that is used to smooth data and filter out noise.  The moving average is also a base indicator for many other indicators you will see in the spread betting strategies you will find in http://www.spreadbettingexamples.com/.

There are two types of averages, the simple moving average and the exponential moving average.


As you can see below, the difference between exponential moving average and simple moving average:

The Simple (SMA) is the green line, it lags a little. Instead the EMA follows the prices more closely (blue line).

Moving Averages - Spreadbetting FTSE

The Simple Moving Average:

The simple moving average as described above is the simple average of the prices.

Calculations:

Prices: 1.4300 1.42931.42591.42771.42681.4238

1.4251

5 Day Average: (1.4300  +

1.4293 +1.4259 +1.4277 +

1.4268 )/5 = 1.42794

1.42794 is the average price of the last 5 days. if the current price is above 1.42794,  this means the current price is stronger than the price of the last five days.

Many spreadbetters use the Moving average as a trend following tool. Those that trade in the direction of the trend, trade with the strength. Therefore if the FTSE is trading below it’s 200 Day moving average this indicates weakness. Trend following spreadtraders will short the FTSE Rolling Bet.


Next Page: Exponential Moving average.


Spread Trading the MACD – Moving Average crossover

The way spread betters trade or interpret the moving average crossover is they wait for the signal line to cross over the MACD line, simply explained, the 9 EMA (which is the Fast line) cross the 26 EMA(the slower of the two lines).  Below is an example of the FTSE 100 Index using the MACD Moving Average Crossover:
 

FTSE 100 - MACD Crossover-Spreadbetting(1)


The MACD line is created by a 12 EMA moving average and a 26 EMA moving average.

A example of a spread betting strategy is:

Long:

when the MACD Signal Line (9 EMA – green Line) crosses the 26 EMA to the upside.

Short:

when the MACD Signal Line (9 EMA- Blue Line) crosses the  26 EMA to the downside.


The MACD can be used in another two was. That is using the MACD Histogram and using the MACD to spread trade Convergence and Divergence.


Next Page: Spread Trading with the MACD Histogram

MACD-Moving Average Convergence-Divergence

The MACD developed by George Appel, is a very popular indicator. Personally one of my favourites. Below I will discuss three main spreadbetting strategies with the MACD. How it is calculated in three steps:

  1. MACD: Calculate the spread between a 26-Day EMA (Exponential Moving Average) – 12 EMA. This differential represents price velocity
  2. MACD Signal Line: 9 Day EMA of the MACD Line.
  3. MACD Histogram: The MACD minus the MACD Signal Line

The MACD is a very effective and popular tool. There are three main strategies used to spreadbet with the MACD.

  • MACD – Moving Average crossover
  • MACD – Divergences
  • MACH – Histogram

Next Page:Spread Trading the MACD – Moving Average Convergence Divergence

SpreadTrading the Momentum Indicator

Trading with the momentum Indicator:


 Trend Following

Some like trading with the strength in the Spreadbetting markets and take a long or short position once the Momentum indicator crosses the 50 line. The momentum indicator can be used in both scalping and swing trading. In scalping it would indicate in which direction to spread trade.

Long trade: when the momentum indicator crosses the an absolute value, (often the 50) line to the upside

Short trade: when the momentum line crosses to the downside.

Closing your trade. The momentum indicator is not a good indicator to use to close our trade, because by the time it crosses the 50 line again, most of our profits have been eaten away. You should apply always your money management rules, and look for the when the moment indicator is turning, this would be


Divergence Trading

The momentum indicator is a strong divergence indicator, as prices diminish on their uptrend or down trend velocity the momentum indicator will start turning, thus forming divergence. This is an important concept in technical analysis, the velocity of the price  movement is a leading indicator in a change of trend.


Bullish Divergence can indicate the end of a down trend.


Previous Page:The Momentum Indicator


Momentum Indicator

Momentum Indicator

The Momentum indicator is a very simple and straight forward indicator. It tells you essentially what has been the recent change between the price of your current spread bet and the previous price of n days ago. What this relationship tells you is if your current price is stronger or weaker than the previous price. It is very similar to the ROC (Rate of Change).

It is constructed in a very simple way. It is the current price, lets say of the FTSE , minus the price of the FTSE 20 Bars ago.


  • Current Price – the Price N days ago.


Therefore if the price is below the momentum indicator, we are seeing weakness of the FTSE vs. it’s price N days ago.

If instead the price is above the momentum indicator, we are seeing strength.


An example of the momentum indicator:

Momentum Indicator


page: 

Next Page:Trading with the momentum Indicator


Trading the Commodity Channel Index (CCI)

Trading the Commodity Channel Index (CCI)

Reversal Strategy

Commodity Channel Index (CCI)

 Many use the CCI as an oscillator, as it comprises of 75% of the prices within -100 and +100:

 Spread bet Sell signal: when the channel crosses above the +100 and then falls back below the +100 line.

Spread bet Buy signal: when the channel crosses above the +100 and then falls back below the +100 line.


Trend Following Strategy

The CCI Channels can also indicate when a trend is starting:

Uptrend: When the CCI is above +100 and stays there this indicates a trend is underway. Often this is used with other indicators as a confirming tool. You can use a 3 EMA with the CCI Channels. As you can see from the example above.

Downtrend: When the CCI is above +100 and stays there this indicates a trend is underway. Often this is used with other indicators as a confirming tool. You can use a 3 EMA with the CCI Channels.


Previous Page:The Commodity Channel Index (CCI)


Commodity Channel Index (CCI)

Technical Indicator: Commodity Channel Index (CCI)


The Commodity Cannel Index (CCI) is a very popular indicator used mainly to show overbought and oversold areas. Developed by Donald Lambert mainly for commodities, it is not used on a wide variety of products. The CCI measures the current price relative to an average price, usually 20 prices. These have been created so that between +100 (overbought) and -100 (Oversold) they represent 75% of the price movement.

Often found on most spreadbetting charting packages as there is no volume involved. It is very easy to apply to your spreadbet charts.


Next Page:Trading the Commodity Channel Index (CCI)

Average Directional Index (ADX)2

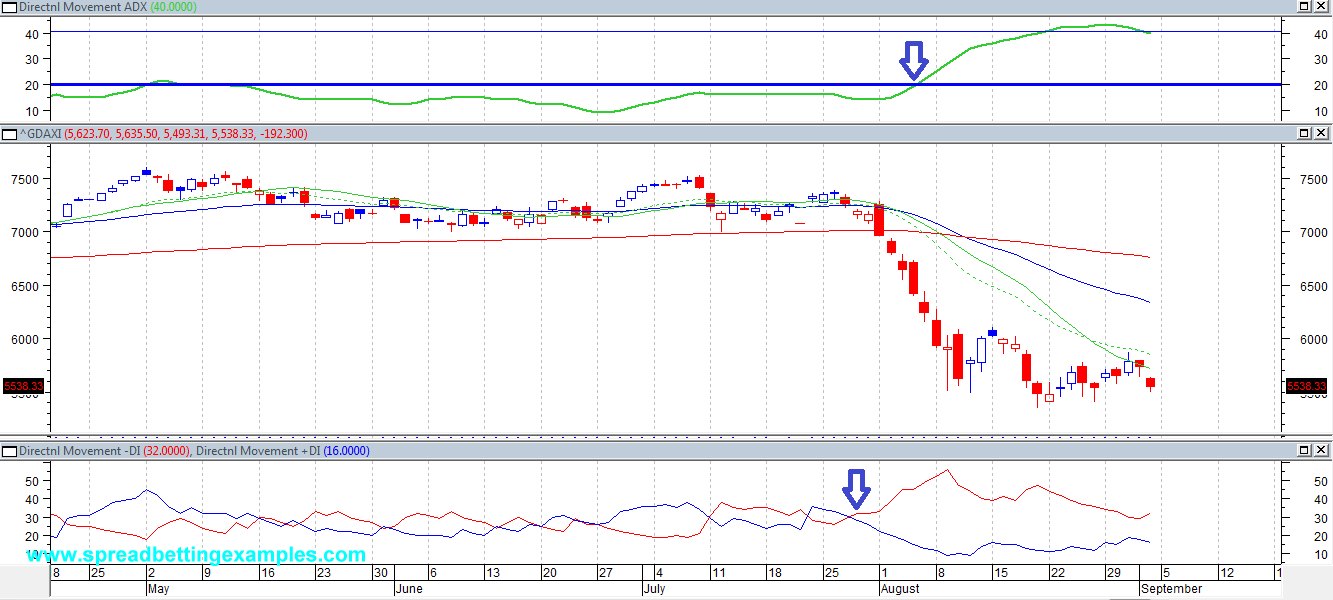
Trading Signals:

+DI Cross –DI

The +DI compares the two consecutive highs and the –DI compares the two consecutive lows.

Wells Wilder states:

-when the ADX >20 and the + DI is above the –DI. Trade/spread bet Long:

-when the ADX >20 and the -DI is above the +DI. Trade/spread bet short:

example:


Combining the ADX with other Indicators:

 Ranging Market: Oscillators

Oscillators: When the ADX < 20, this tells us the market is ranging. In a Ranging market the most effective Indicators to use are Oscillators. When markets start trending again these are no more effective. Common oscillators: Bollinger Bands, Moving Average envelopes, RSI, Slow or Fast Stochastic.


Trending Market: Moving averages

 When the ADX >20, the market is trending.  In a Trending market the most effective Indicators to use are Averages. These keep you in a trend for the long run. An effective strategy that an be used to spread bet the EURUSD is the 3 EMA cross and ADX

Previous Page:The Average Directional Index (ADX) trading signal